
Functions, graphs and coordinate systems
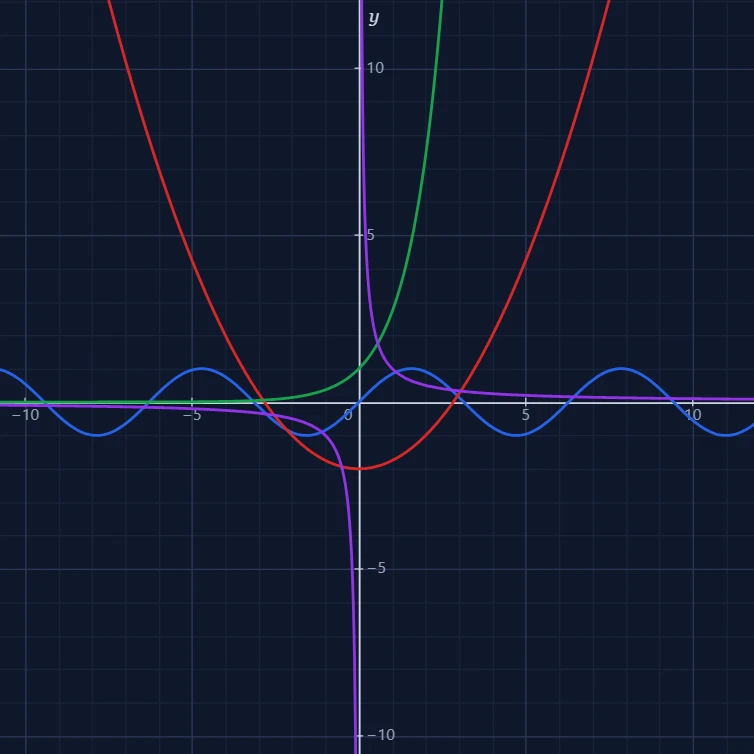
A graph turns a formula into a shape you can see at a glance: where it rises, where it crosses zero and where it shoots off to infinity. This page explains what a function is, how a coordinate system works and how René Descartes made it possible to draw algebra.
What is a function?
A function is a rule that gives exactly one output for every input. The rule f(x) = x² turns 3 into 9 and −3 into 9 as well. The inputs a function accepts form its domain: 1/x has no value at 0, and ln x only works for positive numbers. Functions describe how one quantity depends on another, such as distance on time or the price on the amount you buy.
The Cartesian coordinate system
Two number lines cross at right angles at the origin (0, 0): the horizontal x-axis and the vertical y-axis. Every point in the plane gets an address (x, y): how far to go to the right, then how far up. The graph of a function is the set of all points (x, f(x)), so each x on the axis is lifted to the height of its value. The axes split the plane into four quadrants, numbered anticlockwise from the top right.
René Descartes and analytic geometry
In 1637 the French philosopher René Descartes published La Géométrie as an appendix to his Discourse on the Method. He showed that a curve can be written as an equation and an equation drawn as a curve, so problems of geometry could be solved with algebra. Pierre de Fermat had the same idea at about the same time. The name Cartesian comes from Descartes' Latin name, Cartesius, and the grid with two perpendicular axes was later shaped into the form we use today.
Other coordinate systems
A grid is not the only way to describe a point. Polar coordinates use a distance from the centre and an angle, which makes circles and spirals simple: r = 1 is a circle. Latitude and longitude locate places on the round Earth, and three axes x, y and z describe space. Logarithmic axes squeeze huge ranges into one view, so that exponential growth shows up as a straight line.
Frequently asked questions
What is an asymptote?
A line that a graph gets closer and closer to without reaching it. 1/x has a vertical asymptote at x = 0 and a horizontal one at y = 0, and tan x has a vertical asymptote at every odd multiple of π/2.
What does the parameter a do?
It turns one formula into a family of graphs. With a*x^2 the parabola gets narrower as a grows and flips over when a is negative; with sin(a*x) the wave gets faster. Moving the slider shows how each part of a formula shapes the curve.
Why is it called a Cartesian grid?
It is named after René Descartes, who wrote in Latin as Cartesius. His 1637 work showed how to link points to numbers, the idea behind every graph on this page.
Related tools
Function plotter
A free online function plotter: draw x², sin x, ln x, 1/x and your own formulas on an interactive grid. Pan, zoom, trace x and y, and save the graph as a PNG.
Calculator
A free online calculator with a basic and a scientific mode: trigonometry, logarithms, powers, roots, factorials, memory and history, with the correct order of operations.
The Fibonacci sequence
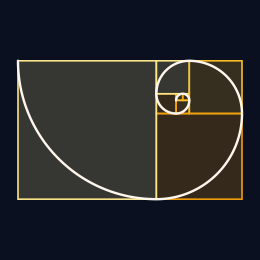
Each Fibonacci number is the sum of the two before it. Watch the squares spiral, the ratios settle on the golden ratio, and Binet's formula rebuild the same numbers.
Monte Carlo π
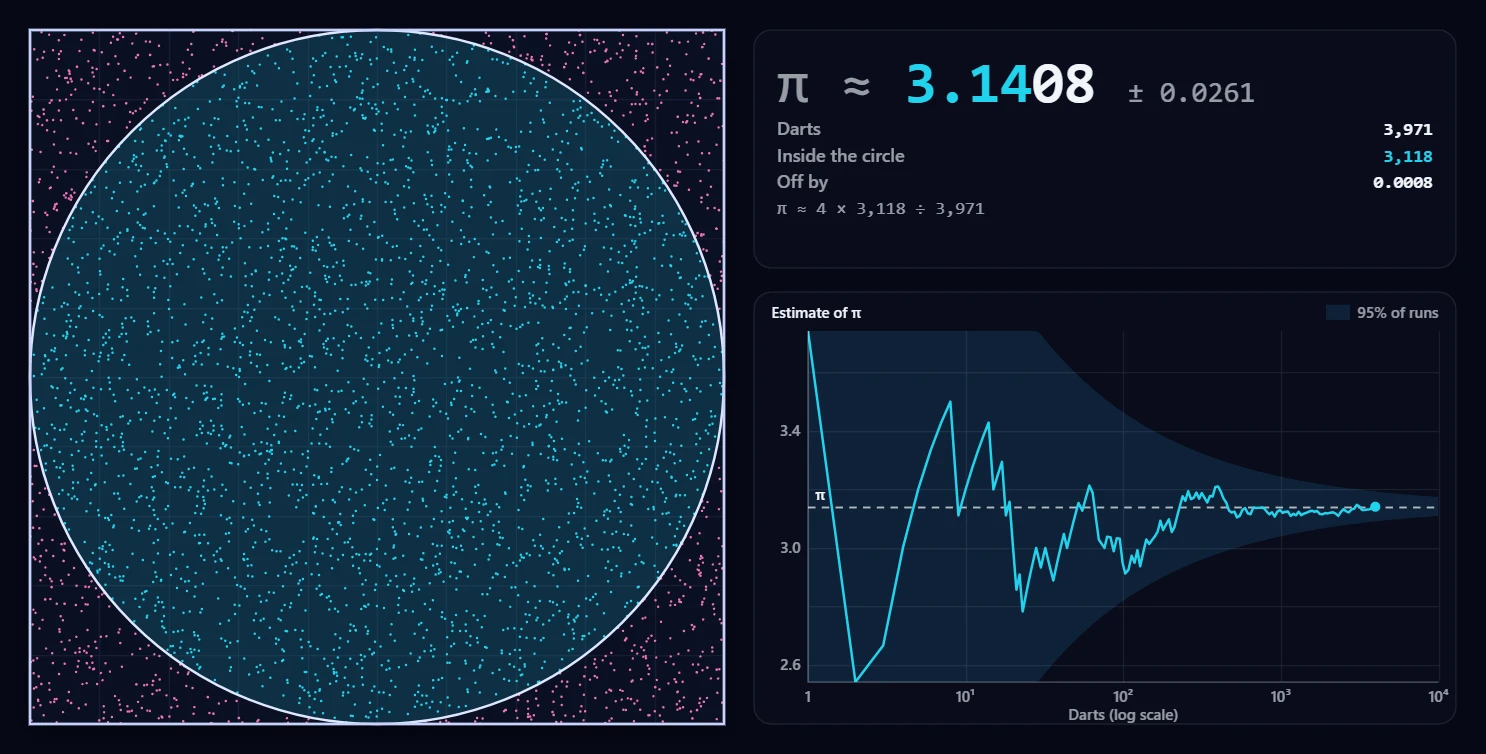
Throw thousands of random darts at a square with a circle in it and watch the share that lands inside turn into π. Start, stop, and follow the estimate as it converges.

The Collatz Conjecture
Explore the Collatz 3n+1 problem in your browser. Walk hailstone sequences, grow a geometric Collatz tree, and zoom the continuous Collatz fractal.
Ready to try it?
Open PictorX in your browser — no install, no credit card required to start.
Open the Function plotter