
Function plotter
Type a formula and see its graph at once. Draw several functions in different colours, move and zoom the coordinate grid, and slide the parameter a to watch a whole family of curves change. Asymptotes and jumps are drawn without false vertical lines. Type a formula such as x^2, sin(x) or a*x + 1, or tap an example. Drag the graph to move it, and use the wheel, a pinch or the + and − buttons to zoom. Hover or tap to read x and y.
How it works
- Type a formula in the box, for example x^2 - 3, sin(x) or 2*x + 1, or tap one of the examples.
- Press Add function to draw more graphs. Each one has its own colour, and the eye button shows or hides it.
- Drag to move the grid, zoom with the wheel, a pinch or the + and − buttons, and hover or tap to read the values. Use a in a formula and move the slider to change it.
Writing formulas
Use x as the variable and a as the parameter. You can write + − * / and ^ for powers, brackets, |x| for the absolute value, pi and e, and functions such as sin, cos, tan, sqrt, ln, log, exp and abs. A number before x or a bracket multiplies, so 2x and 3(x + 1) work too. Angles are in radians.
Asymptotes and gaps
Where a function is not defined, such as ln x for x ≤ 0 or 1/x at 0, the graph simply stops. Where the value jumps, as with tan x, the plotter checks the points in between and lifts the pen, so you never see a false vertical line across an asymptote.
Frequently asked questions
Can I use degrees?
The plotter works in radians, like most graphing tools. To use degrees, convert inside the formula: sin(x*pi/180) draws the sine with x in degrees.
Can I save the graph?
Yes. Save stores the current view as a PNG image, with the legend but without the trace cursor. Edit opens it in the photo editor, for example to add notes.
Is anything sent to a server?
No. The formulas are read and drawn in your browser, and your functions are only remembered on your own device.
Related tools
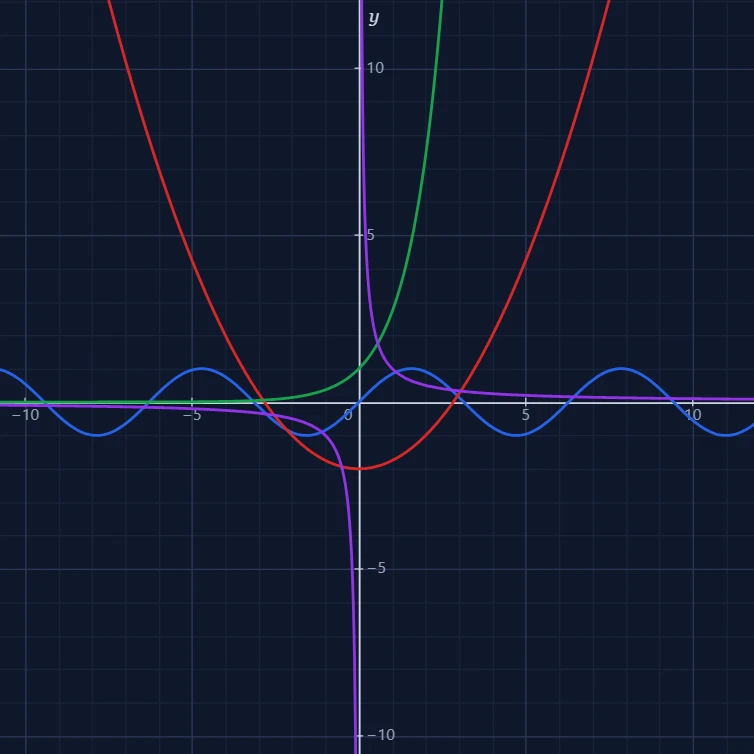
Functions, graphs and coordinate systems
What a mathematical function is, how a coordinate system turns a formula into a picture, and how René Descartes joined algebra and geometry.
Calculator
A free online calculator with a basic and a scientific mode: trigonometry, logarithms, powers, roots, factorials, memory and history, with the correct order of operations.
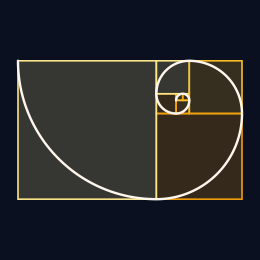
The Fibonacci sequence
Each Fibonacci number is the sum of the two before it. Watch the squares spiral, the ratios settle on the golden ratio, and Binet's formula rebuild the same numbers.
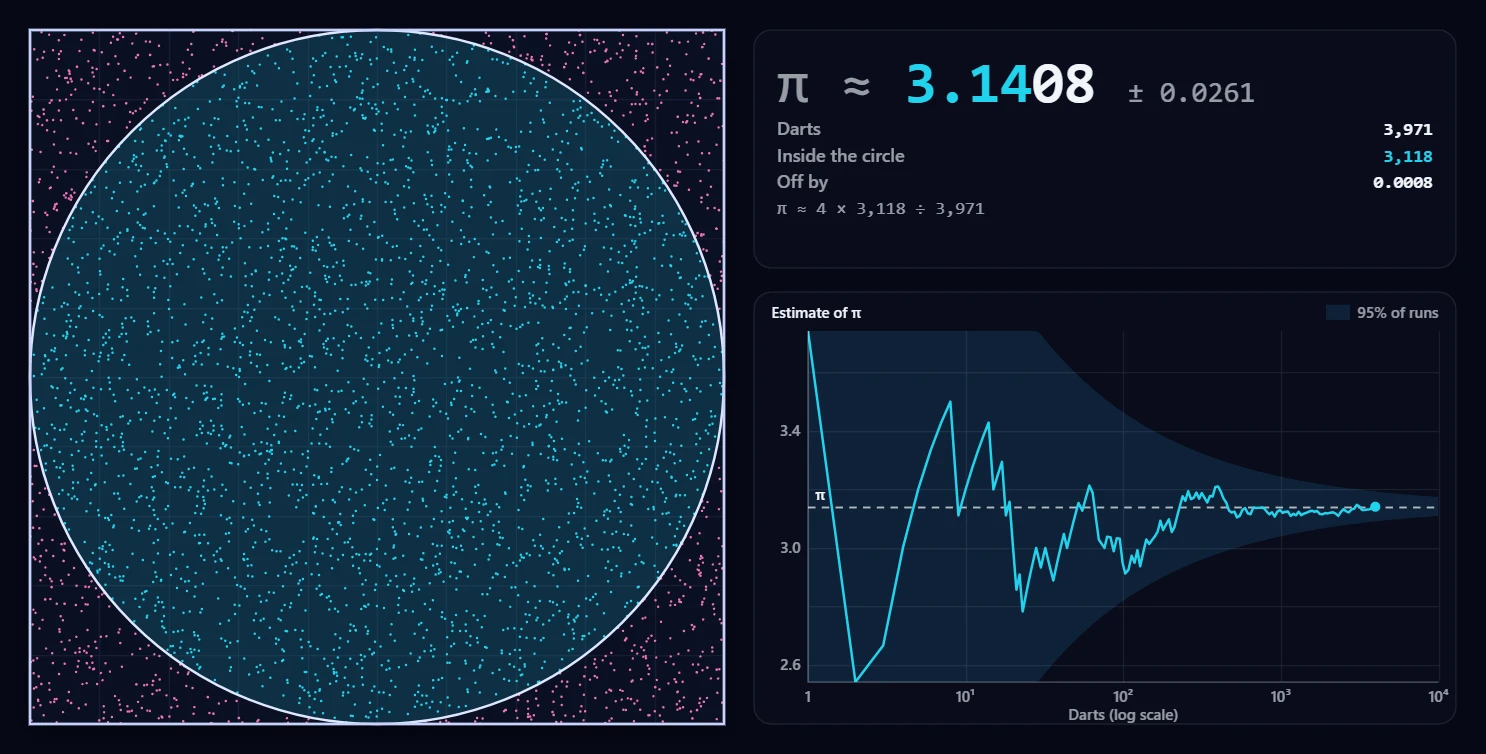
Monte Carlo π
Throw thousands of random darts at a square with a circle in it and watch the share that lands inside turn into π. Start, stop, and follow the estimate as it converges.
Ready to try it?
Open PictorX in your browser — no install, no credit card required to start.
Go to Editor