
Galton board
Balls fall through a triangle of pegs. At every peg a ball bounces left or right, as if by the toss of a coin. Each path is pure chance, yet together the balls pile up in the shape of a bell. That shape is the binomial distribution, and with many rows it becomes the normal curve. Balls drop through the pegs and bounce left or right at each one. Most paths end near the middle, so the bins fill into a bell curve. Turn on Pascal's triangle to count the paths, or set Bias to tilt every bounce.
How it works
- Open this page and the balls start falling. Watch the middle bins fill first and the bell curve grow.
- Set Rows and Balls, or move Bias to make every bounce lean to one side. Turn on Pascal's triangle to count the paths.
- Read the mean and the standard deviation against their expected values, then save a PNG.
Left or right, twelve times
With 12 rows a ball meets 12 pegs, and at each one it goes left or right. Its bin is simply the number of times it went right: from 0 at the far left to 12 at the far right. Six rights and six lefts, in any order, end in the middle.
Why the middle fills first
There is only one path to the far left bin: left every time. There are 924 paths to the middle bin, because 6 rights can be spread over 12 bounces in 924 ways. Those numbers are Pascal's triangle, and they give the bins their bell shape.
Mean and spread
With a fair bounce the average bin is half the rows: 6 for 12 rows. The spread, the standard deviation, is √(n·p·(1−p)), about 1.73 for 12 rows. Set Bias to 70% and the bell slides to the right, to 8.4.
Frequently asked questions
What is a Galton board?
A board with rows of pegs and bins at the bottom. Francis Galton built one in the 1870s to show how chance builds a bell curve. It is also called a bean machine or a quincunx.
Why is it a bell curve?
Each bin collects the paths with a certain number of right bounces. Paths with about as many rights as lefts are by far the most common, so the middle bins fill most. With many rows the binomial distribution looks just like the normal curve.
What does Bias do?
It sets the chance that a ball bounces right at each peg. At 50% the bell sits in the middle. At 70% every bounce leans right and the bell moves over, but it keeps its shape.
Why don't the bins match the curve exactly?
Every ball is a new random path. With few balls the bins scatter around the curve. The more balls you drop, the closer they follow it.
Does this upload anything?
No. The board is drawn on a canvas in your browser. Save downloads a PNG. Edit opens that image in the PictorX editor.
Related tools
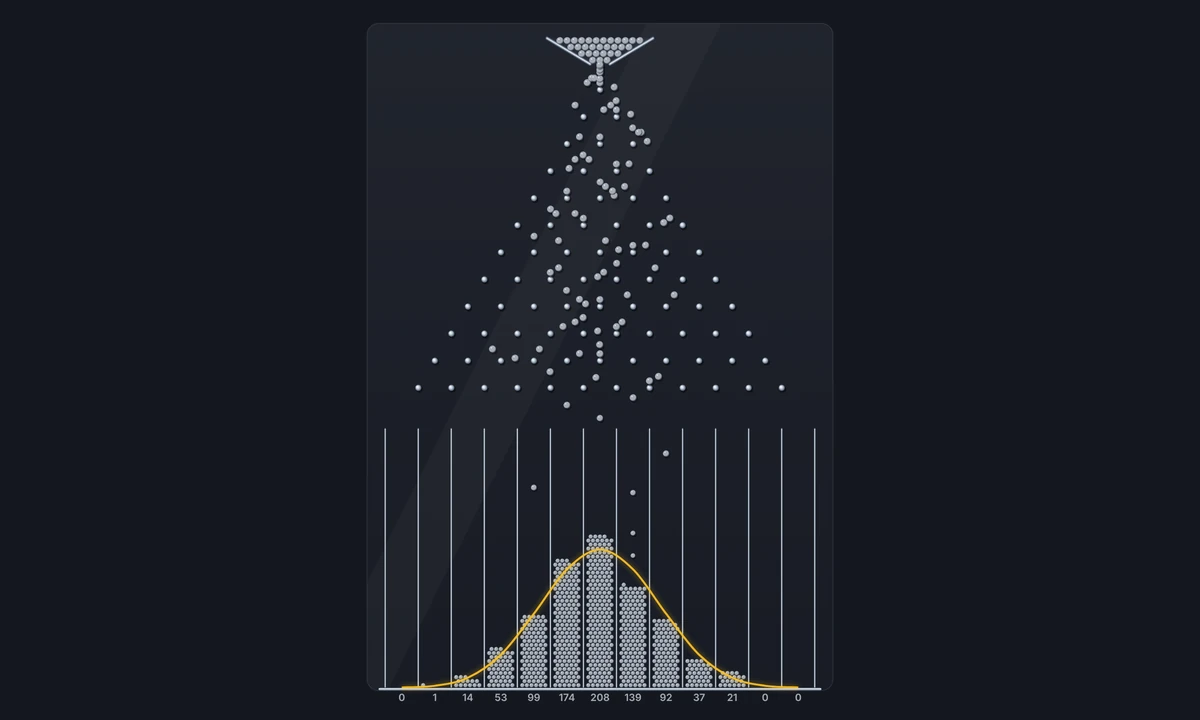
Galton board
How a Galton board works: random bounces, Pascal's triangle, the binomial distribution, and how the bell curve of the normal distribution appears from pure chance.

Buffon's Needle
Drop needles on a lined floor in your browser. Count the crossings and watch Buffon's 1777 experiment estimate π.
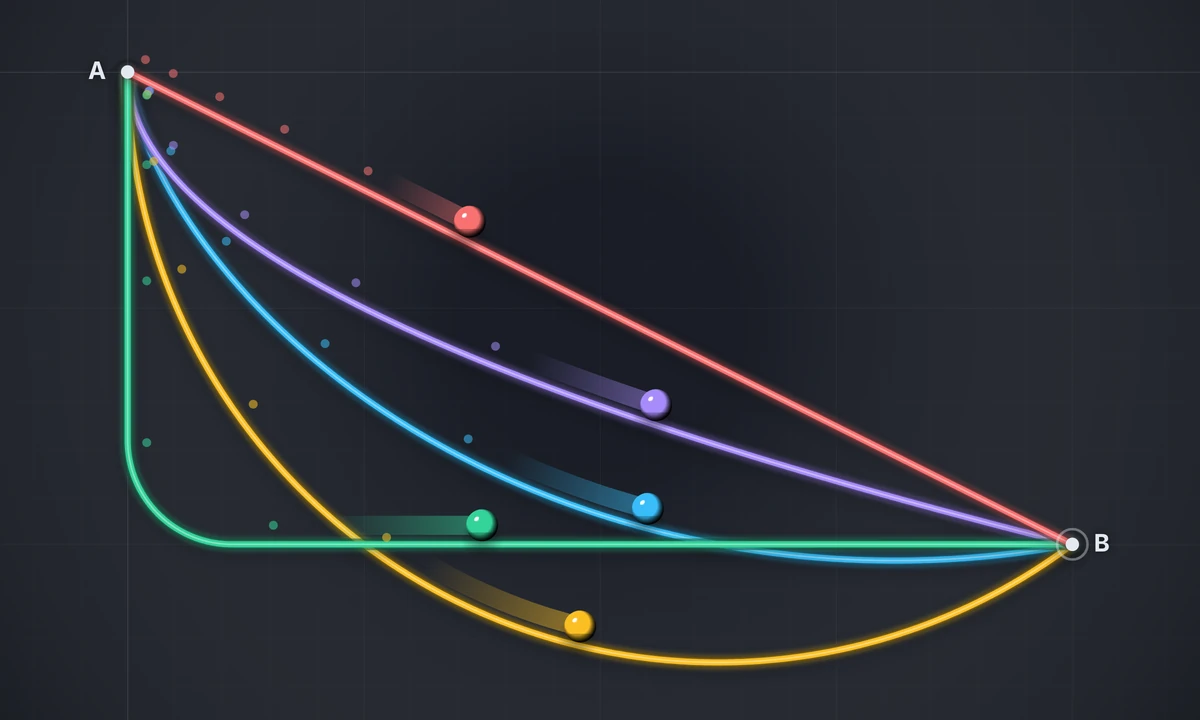
Brachistochrone race
Race balls from A to B on a straight ramp, a circle, a parabola, and a cycloid. The cycloid always wins, even when it dips below the finish. Draw your own track.
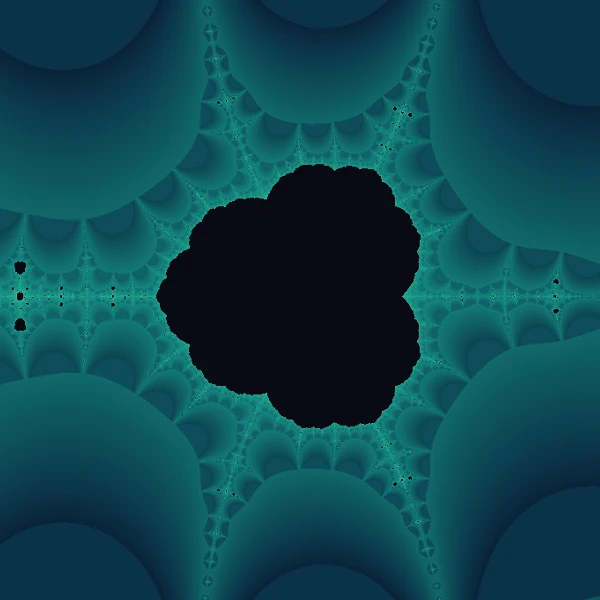
The Collatz Conjecture
Explore the Collatz 3n+1 problem in your browser. Walk hailstone sequences, grow a geometric Collatz tree, and zoom the continuous Collatz fractal.
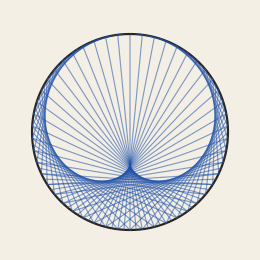
Multiplication Circles
Join each number on a circle to its multiple. Draw a times table, a cardioid, or a string figure on paper, chalk, or wood.
Ulam spiral
Draw the Ulam spiral in your browser. Mark the primes, read the quadratic on each diagonal, and open Euler's unbroken run of 40 primes.
Ready to try it?
Open PictorX in your browser — no install, no credit card required to start.
Go to Editor