
Mean, spread and the normal distribution
A list of numbers rarely speaks for itself. Two or three summary values, one for the centre and one for the spread, usually tell you most of what you need to know. This page explains what those values mean and when each one is the right choice.

Mean or median?
The mean adds all values and divides by how many there are. The median is the middle value once the list is sorted. For symmetric data they are almost equal, but a few extreme values pull the mean towards them while the median hardly moves. That is why incomes and house prices are usually reported as a median: one billionaire raises the mean income of a village, not the median.
Variance and standard deviation
Two classes can have the same average mark while one is far more mixed than the other. Variance measures that spread: take each value's distance from the mean, square it so negative and positive distances do not cancel, and average the squares. Because squaring changes the unit (centimetres become square centimetres), we usually take the square root. That is the standard deviation, a typical distance from the mean in the original unit.
Sample or population: why n - 1?
If your numbers are the whole group, divide the sum of squares by n: that is the population variance. Usually, though, the numbers are a sample, and you want to estimate the spread of the larger group. The sample's own mean is always the best fit for the sample, so distances to it come out slightly too small. Dividing by n - 1 instead of n, known as Bessel's correction, makes up for that. For large samples the difference is tiny; for five values it is 25 per cent.
Gauss and the normal distribution
Around 1809 Carl Friedrich Gauss used a bell-shaped curve to describe errors in astronomical measurements. This normal distribution turns up whenever many small, independent effects add together, as with heights, measurement errors and exam scores. It is fully described by its mean and standard deviation: about 68 per cent of values lie within one standard deviation of the mean, 95 per cent within two and 99.7 per cent within three. If your histogram looks like a bell, those rules of thumb apply.
Frequently asked questions
What is an outlier?
A common rule calls a value an outlier when it lies more than 1.5 times the interquartile range below Q1 or above Q3. In the box plot, the whiskers stop at the last value inside that range, and anything beyond is drawn as a separate dot.
Is all data normally distributed?
No. Waiting times, incomes and file sizes are usually skewed, with a long tail on one side. Then the mean lies away from the median and the 68-95-99.7 rule no longer holds. Comparing mean and median, and looking at the histogram, is a quick first check.
What does the interquartile range tell me?
The IQR is Q3 minus Q1, the width of the middle half of your data. Like the median, it ignores the extremes, so it is a robust measure of spread for skewed data or data with outliers, where the standard deviation can be misleading.
Related tools
Statistics calculator
A free online statistics calculator: paste numbers and get the mean, median, mode, variance, standard deviation, quartiles and a histogram instantly.
Calculator
A free online calculator with a basic and a scientific mode: trigonometry, logarithms, powers, roots, factorials, memory and history, with the correct order of operations.
Function plotter
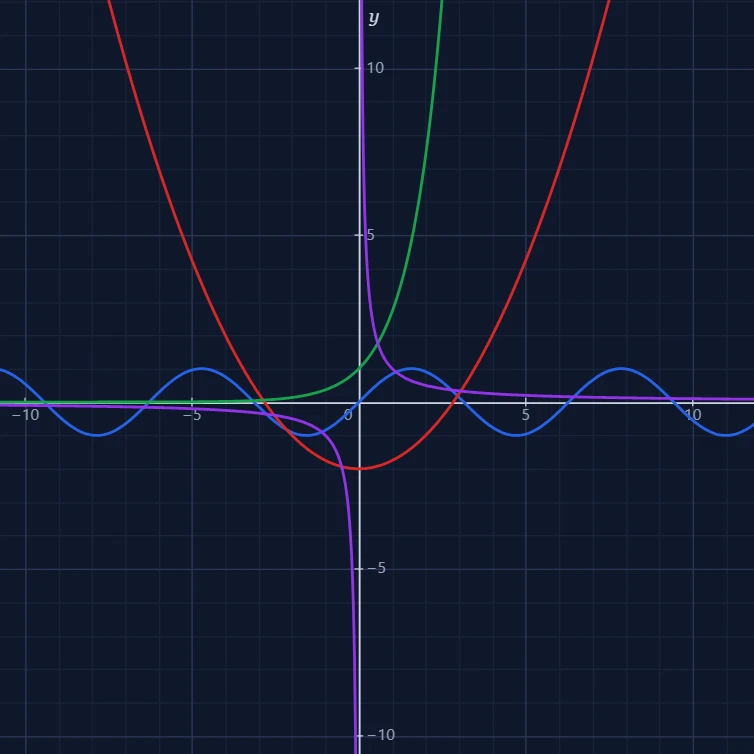
A free online function plotter: draw x², sin x, ln x, 1/x and your own formulas on an interactive grid. Pan, zoom, trace x and y, and save the graph as a PNG.
Unit converter
A free online unit converter for length, weight, temperature, speed, area, volume, time, pressure, energy and computer data - bytes to gigabytes and GB to GiB.
Ready to try it?
Open PictorX in your browser — no install, no credit card required to start.
Open the Statistics calculator