
Enter at least one number to see the results.
- Sum
- -
- Minimum
- -
- Maximum
- -
- Range
- -
- Mode
- -
- Geometric mean
- -
- Skewness
- -
- Excess kurtosis
- -
- Sample variance (s²)
- -
- Population variance (σ²)
- -
- Population standard deviation (σ)
- -
- Standard error of the mean
- -
- Coefficient of variation
- -
- First quartile (Q1)
- -
- Third quartile (Q3)
- -
- Interquartile range (IQR)
- -
- Outliers (1.5 × IQR rule)
- -
Sorted data
Frequency table
| Interval | Frequency | Relative frequency |
|---|
Statistics calculator
Paste a column from a spreadsheet, a list of test scores or a row of measurements, and every common summary statistic appears at once. Nothing is sent to a server: the numbers stay in your browser. Type or paste numbers separated by commas, spaces, semicolons or new lines. Both 2.5 and 2,5 work when the numbers are separated by spaces or semicolons. The results and the chart update as you type.
How it works
- Type or paste your numbers into the box, or press Example data.
- Read the results: centre, spread and quartiles update with every keystroke.
- Use Copy results to paste them elsewhere, or save the chart as a PNG.
Commas, points and separators
A list such as 1,5 2,5 3 is read as 1.5, 2.5 and 3, because the numbers are separated by spaces. A list such as 1,2,3 or 1, 2, 3 is read as three whole numbers. When in doubt, put each number on its own line or use semicolons.
How the quartiles are calculated
There are several ways to compute quartiles. This calculator uses linear interpolation between sorted values, the same method as QUARTILE.INC in Excel and the default in many statistics packages. For small data sets other methods can give slightly different answers.
Frequently asked questions
Should I use sample or population standard deviation?
Use the sample value (s) when your numbers are a selection from a larger group, which is almost always the case. Use the population value (σ) only when you have every member of the group, such as all pupils in one class.
Why can there be more than one mode?
The mode is the value that occurs most often. If two values tie, for example 3 and 7 both appear four times, both are modes. If every value appears only once, there is no mode.
Are my numbers sent anywhere?
No. All calculations run in your browser. Your last input is only kept in your browser's local storage, so it is still there when you come back.
Related tools

Mean, spread and the normal distribution
When to use the mean or the median, what variance and standard deviation measure, why the sample formula divides by n - 1, and how Gauss's normal distribution fits in.

Calculator
A free online calculator with a basic and a scientific mode: trigonometry, logarithms, powers, roots, factorials, memory and history, with the correct order of operations.
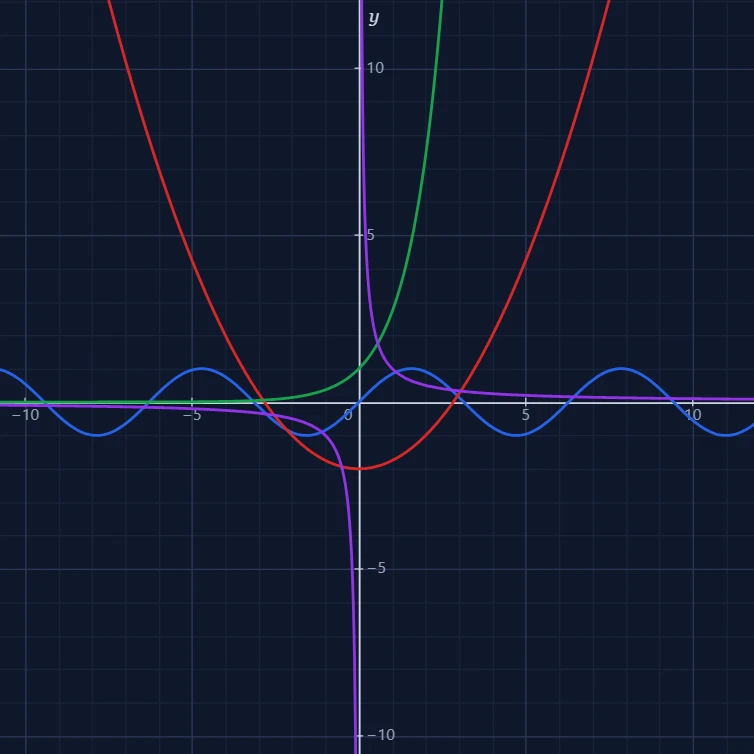
Function plotter
A free online function plotter: draw x², sin x, ln x, 1/x and your own formulas on an interactive grid. Pan, zoom, trace x and y, and save the graph as a PNG.

Unit converter
A free online unit converter for length, weight, temperature, speed, area, volume, time, pressure, energy and computer data - bytes to gigabytes and GB to GiB.
Ready to try it?
Open PictorX in your browser — no install, no credit card required to start.
Go to Editor