
- Training points
- Test points
- Decision boundary
- Training loss
- Test loss
Neural network sandbox
A neural network is a stack of simple units that add up weighted inputs and pass the sum through a bend. On its own each unit can only draw a straight line, yet together they can trace a circle, a spiral or anything else. Pick a dataset, build a network of up to four hidden layers, press Train and watch the boundary between blue and orange bend into shape, epoch by epoch, while every neuron shows the part of the pattern it has learned to detect. Choose a dataset and a network, then press Train and watch the network learn to separate the blue points from the orange ones. Filled points train the network; rings are test points it never trains on. The background shows the network's answer for every point of the plane, and the line is where it changes its mind. In the diagram each neuron shows what it responds to, and each connection is blue for a positive weight and orange for a negative one, thicker when it is larger. Click the plane to add points of the colour chosen under Click adds.
How it works
- Choose a dataset, from two blobs that a straight line can split to a spiral that needs several layers, or click the plane to place your own points.
- Set the hidden layers, the neurons per layer, the activation, the learning rate and the inputs the network gets.
- Press Train and watch the boundary, the neurons and the loss; compare the training loss with the test loss to spot overfitting.
What the network does
Each neuron multiplies its inputs by weights, adds a bias, and passes the total through an activation function such as tanh or ReLU. The neurons of the first hidden layer each split the plane along one straight line, softened into a gradient. The next layer combines those half-planes into wedges, bands and blobs, and the output neuron turns the result into a probability for blue. The background of the plane shows that probability everywhere, and the dark line is where it is exactly one half: the decision boundary.
How it learns
Training starts from random weights. For a small batch of training points the network compares its answers with the true colours, and backpropagation works out, from the output back to the inputs, how much each weight contributed to the error. Every weight then moves a small step, the learning rate, in the direction that lowers the loss. One pass over all training points is an epoch. A learning rate that is too small makes progress slow; one that is too large makes the loss jump around or blow up. The test points are never used for training, so the test loss shows how well the network generalises.
Frequently asked questions
Why can't a network without hidden layers learn the circle or XOR?
Without hidden layers the output is a function of one weighted sum of the inputs, so the boundary is a straight line. No straight line puts the inside of a circle on one side and the ring on the other, or separates the two diagonals of XOR. Marvin Minsky and Seymour Papert made this point about single-layer perceptrons in 1969. A hidden layer fixes it, and so does an extra input: with x² and y² the circle becomes a straight cut, and with x·y so does XOR.
What is overfitting, and how do I see it here?
A network overfits when it learns the training points by heart, noise included, instead of the pattern behind them. Choose a noisy dataset with few points and a large network, and train for a long time: the training loss keeps falling while the test loss levels off and starts to rise, and the boundary grows little islands around single points. Fewer neurons, more points or stopping earlier help.
Which activation function should I use?
Tanh gives smooth, rounded boundaries and trains well on these small problems. ReLU, which is zero for negative sums and the sum itself otherwise, is the default in modern deep learning and gives boundaries made of straight pieces. Sigmoid learns more slowly in hidden layers because its slope is small. Linear makes every hidden layer pointless: a stack of linear layers is still one linear function, so the boundary stays straight.
What do the small pictures in the network diagram mean?
Each one shows a neuron's output for every point of the plane, blue for high and orange for low. Input neurons show x, y and the other inputs, the first hidden layer shows soft half-planes, and deeper neurons show the more complex shapes built from them. The connections are blue for positive weights and orange for negative ones, thicker when the weight is larger.
Is anything sent to a server?
No. The data, the network and the training all run in your browser in plain JavaScript, with no machine learning library. Your settings and the points you click in stay in this browser's local storage.
Related tools
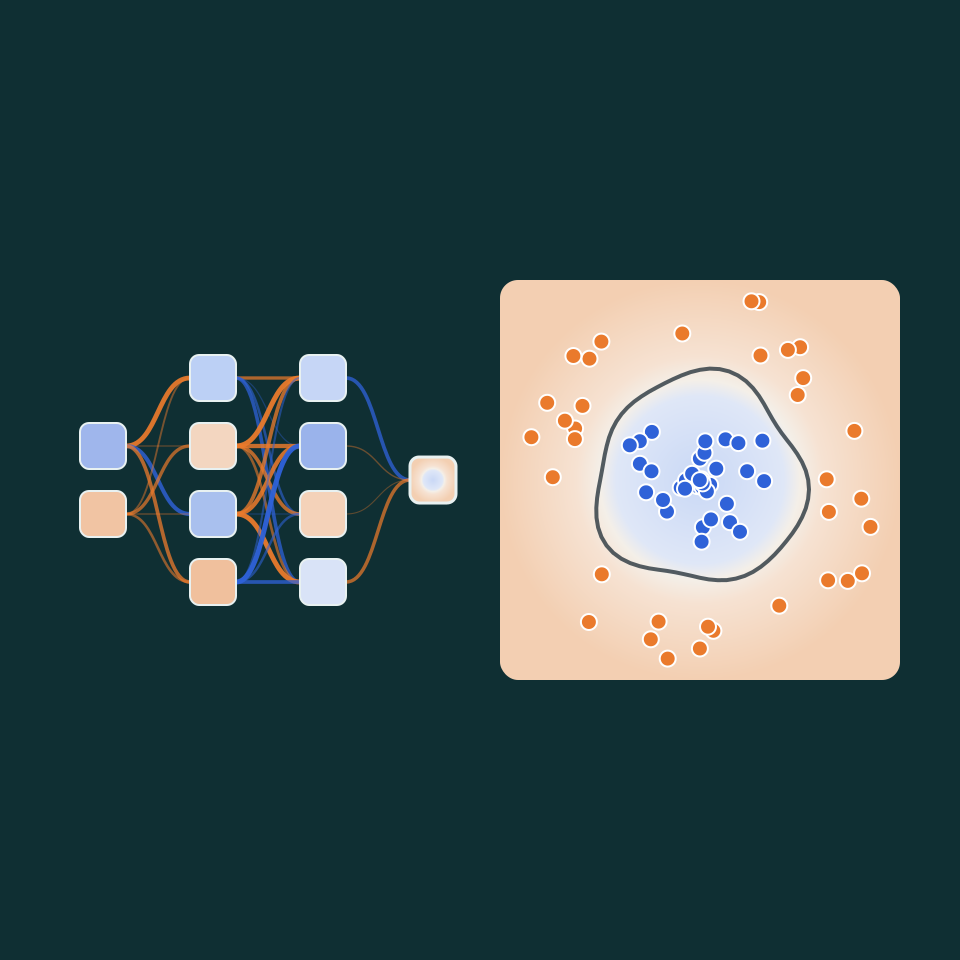
Neural networks explained
How a neural network works, from a single neuron to hidden layers: weights and biases, activation functions, the loss, gradient descent, backpropagation, the learning rate and overfitting.
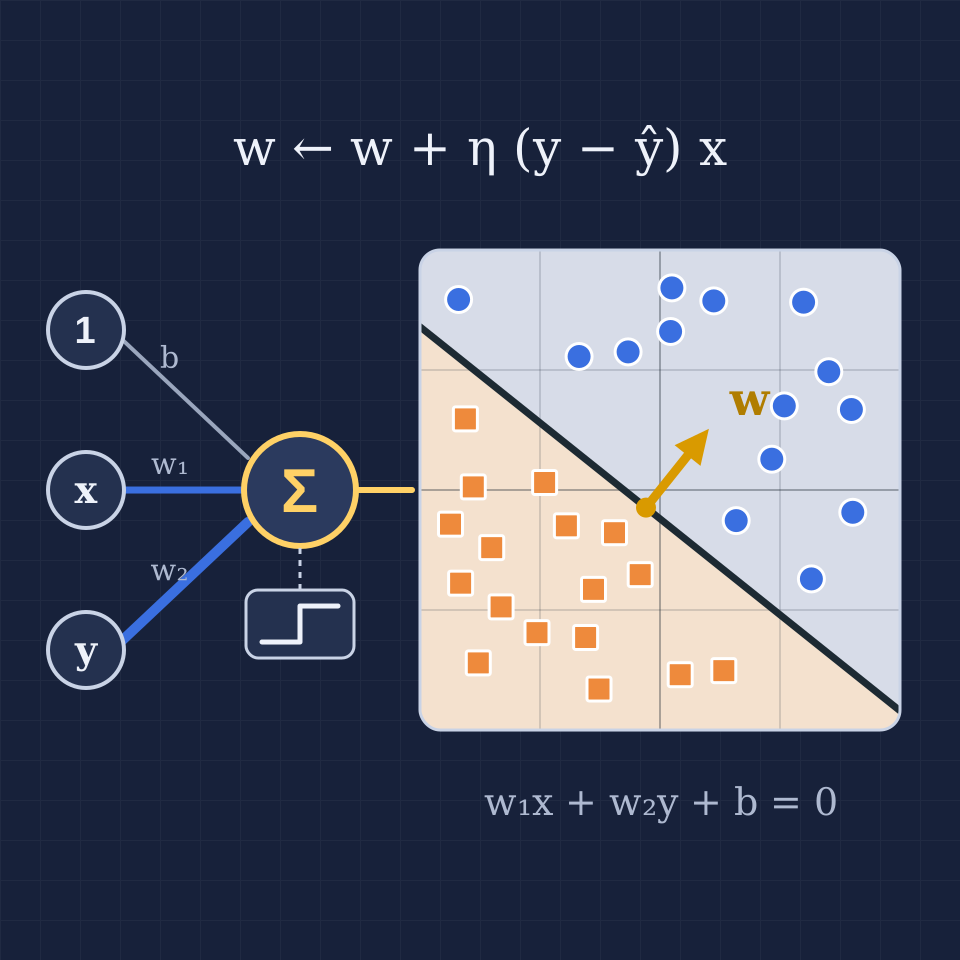
Perceptron visualizer
Train Rosenblatt's perceptron in your browser: step through the learning rule one sample at a time, watch the decision boundary and the weight vector move, and see why AND and OR are learned but XOR never is.
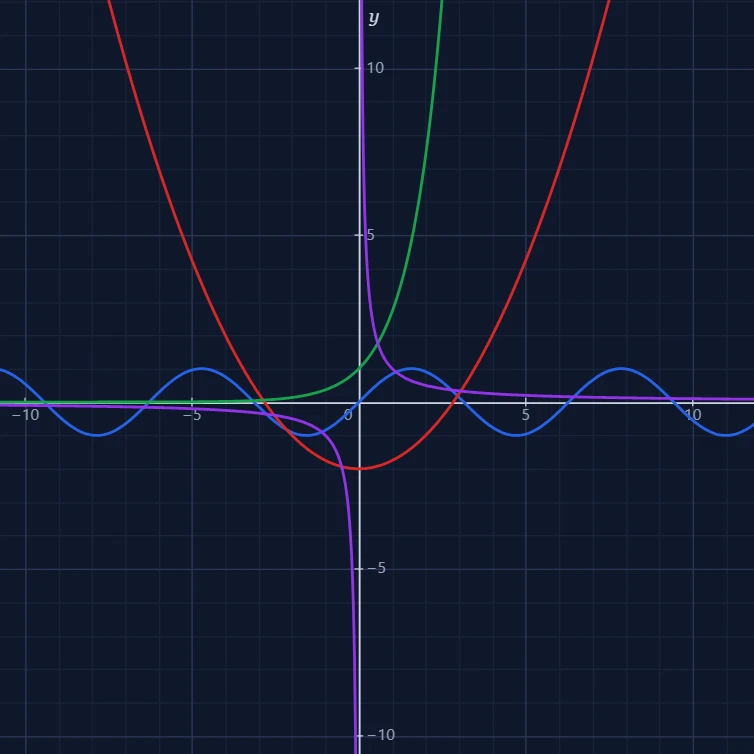
Function plotter
A free online function plotter: draw x², sin x, ln x, 1/x and your own formulas on an interactive grid. Pan, zoom, trace x and y, and save the graph as a PNG.
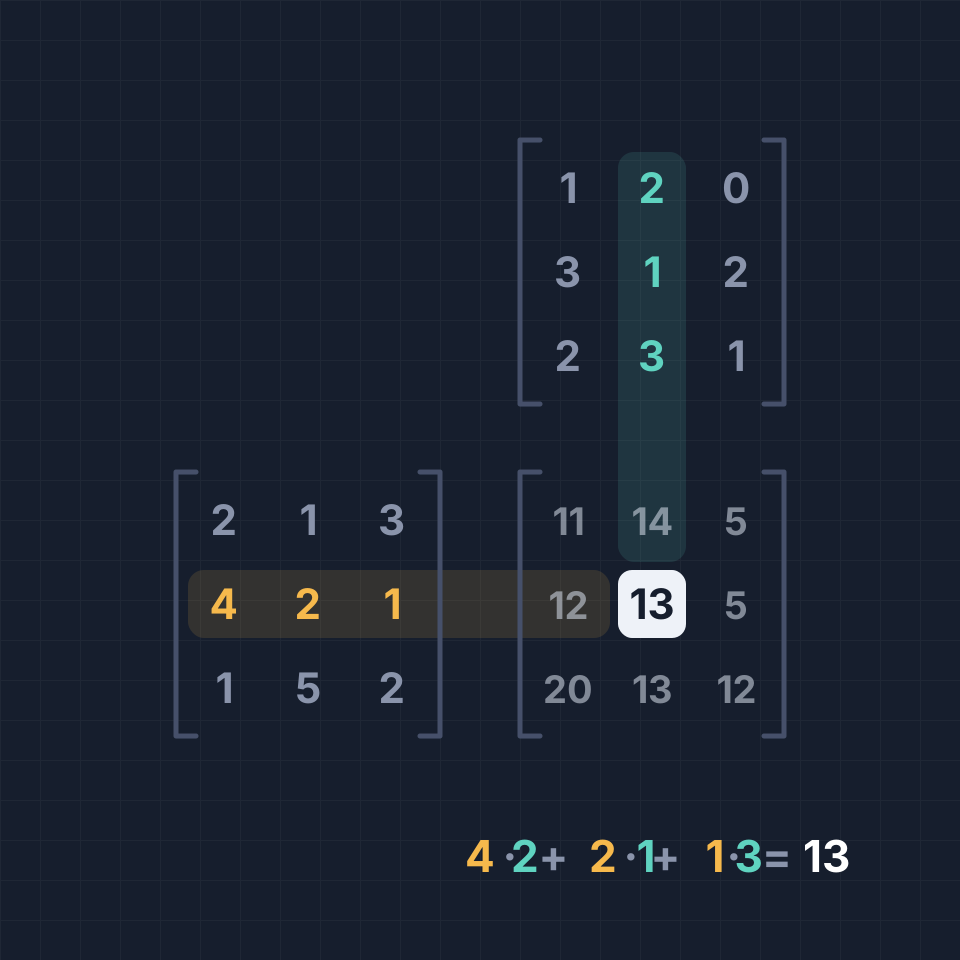
Matrix calculator
A free online matrix calculator: add, subtract, multiply, transpose and invert matrices up to 6x6, with determinant, rank, powers and exact fractions.
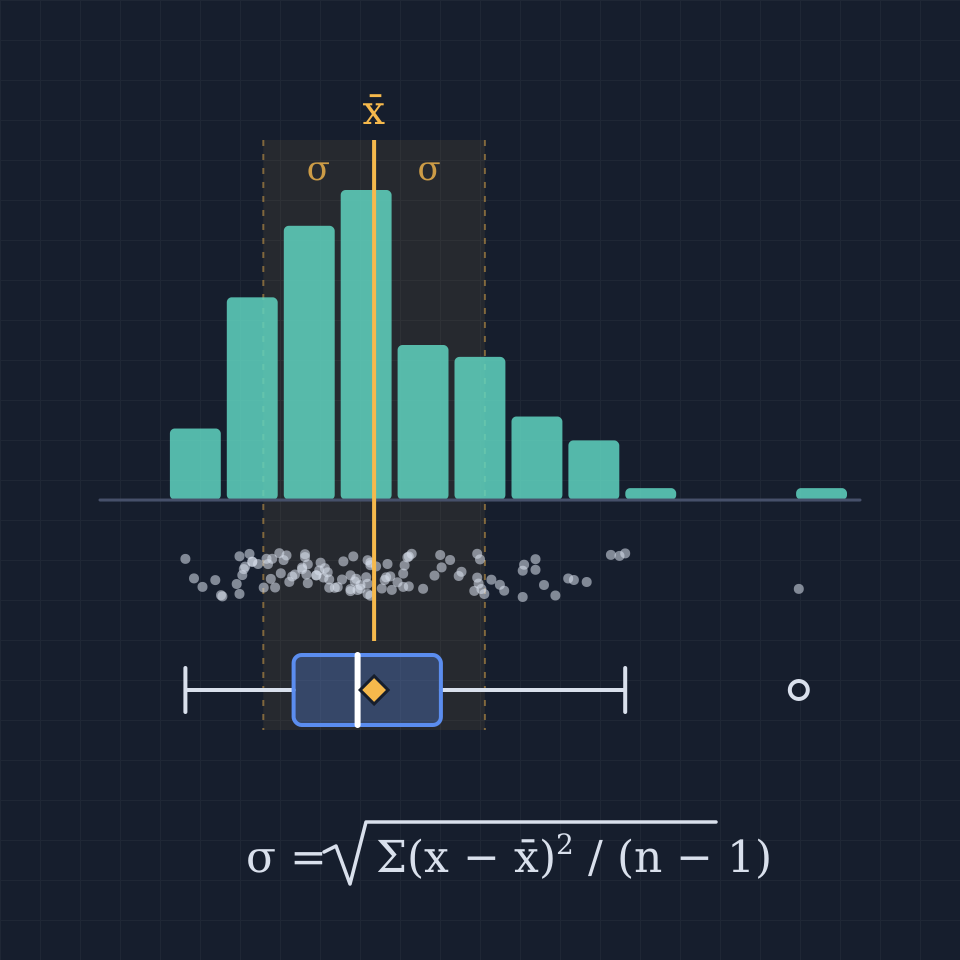
Statistics calculator
A free online statistics calculator: paste numbers and get the mean, median, mode, variance, standard deviation, quartiles and a histogram instantly.
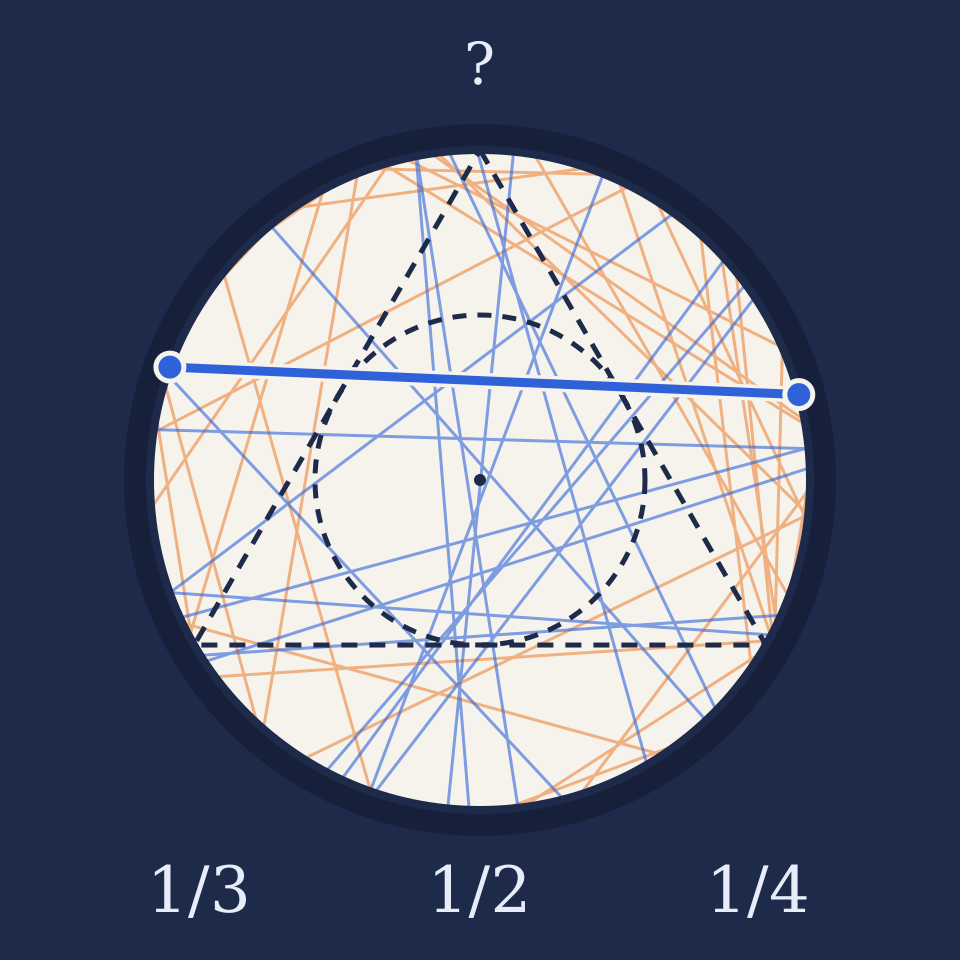
Bertrand's paradox
Draw random chords of a circle four ways and watch the share longer than the triangle's side settle at 1/3, 1/2 or 1/4. See the midpoints, the theory curve, and Jaynes's straws.
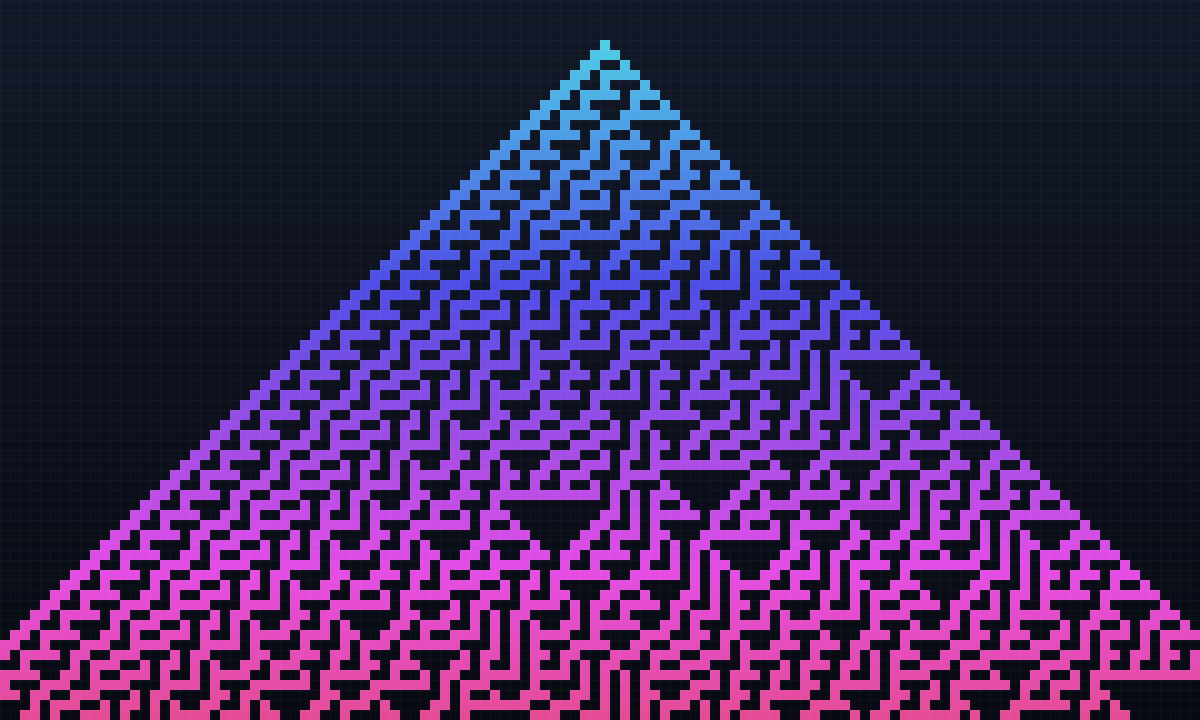
Cellular Automata
Run Conway's Game of Life, Rule 30, Rule 110, Brian's Brain, and Wireworld in your browser. Draw cells, change the rule, and watch simple rules grow complex patterns.
Ready to try it?
Open PictorX in your browser — no install, no credit card required to start.
Go to Editor