
Living charts & data tool
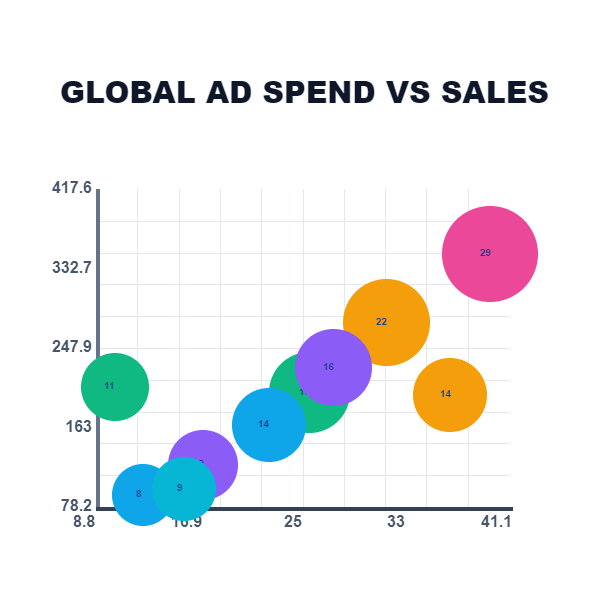
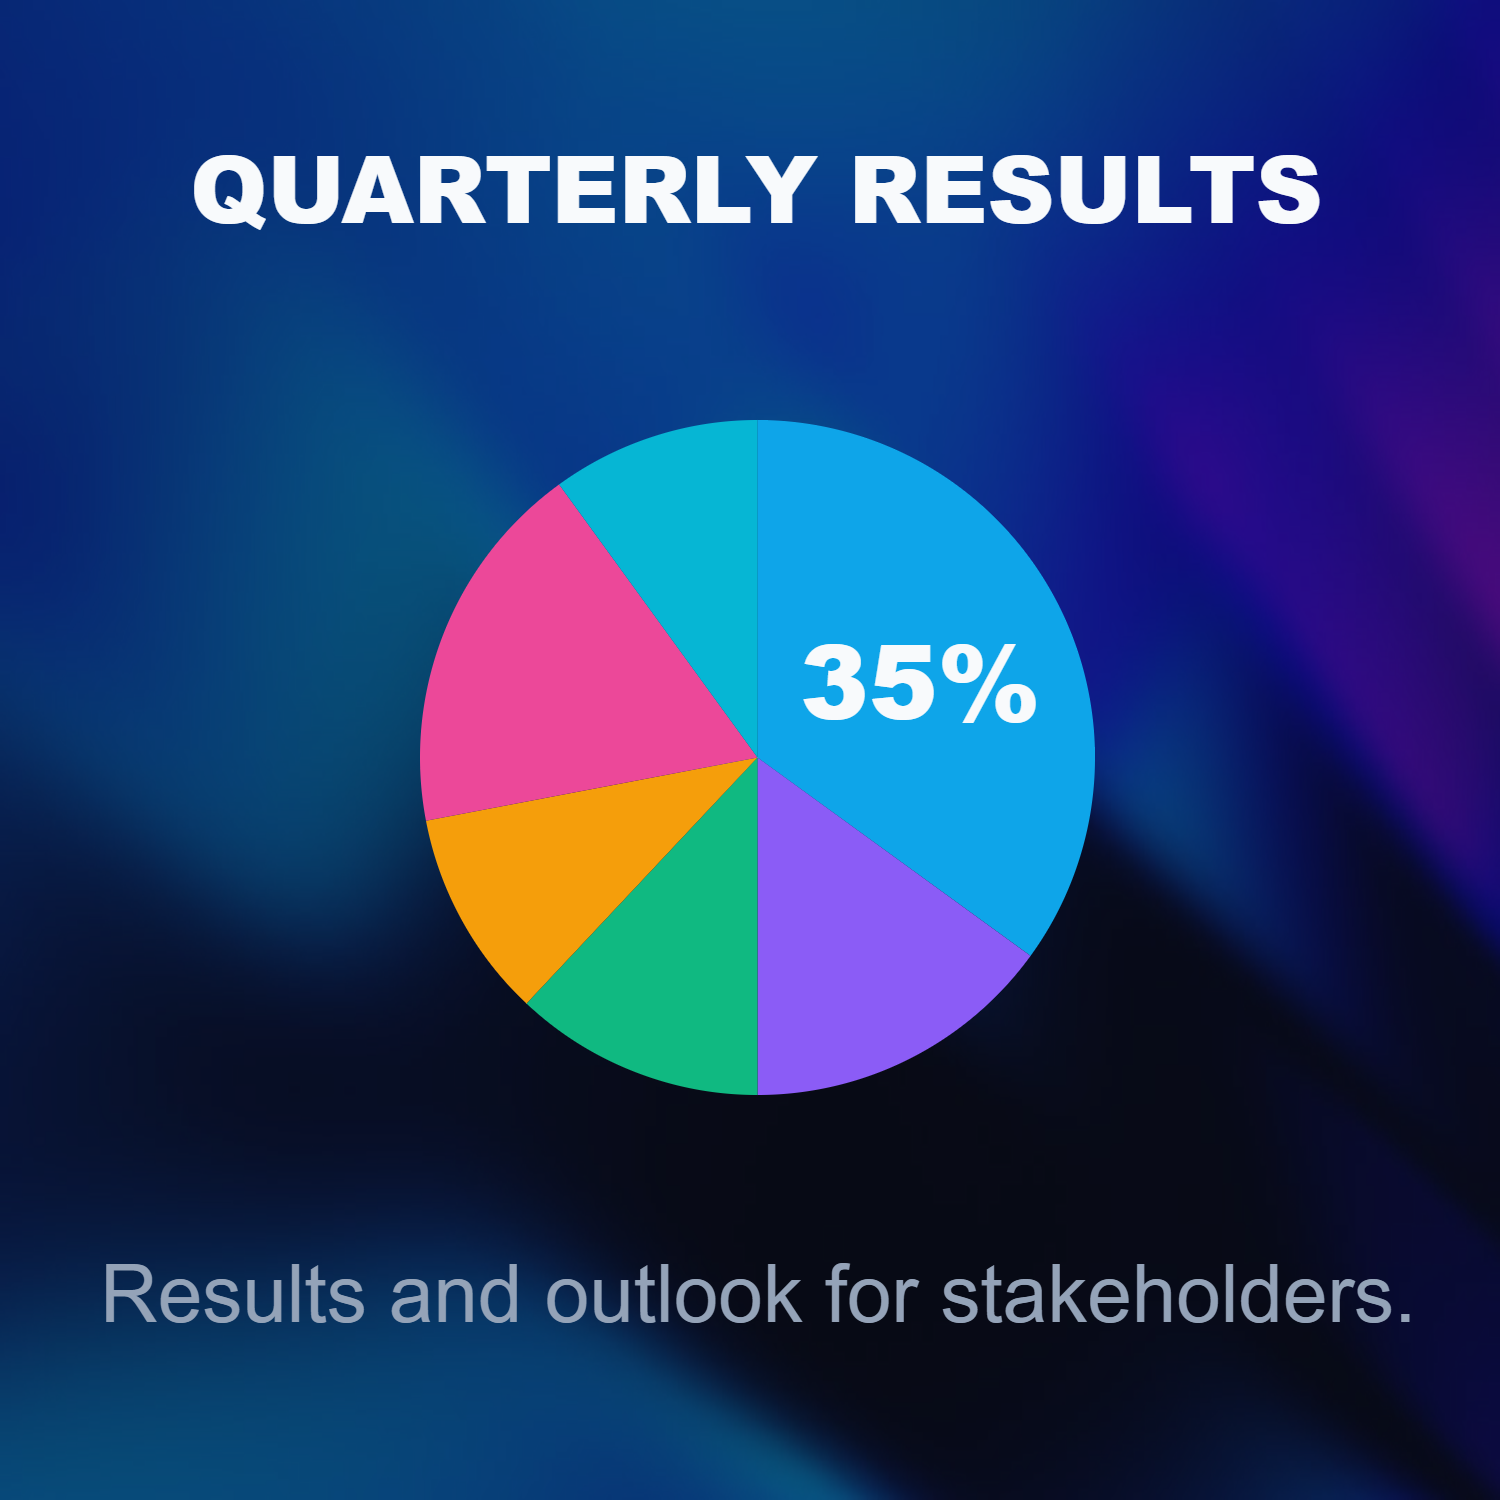
Tell stories with numbers—not spreadsheets. Insert column, bar, line, pie, radar, heatmap, treemap, gauge, Venn, and more from CHARTS MENU. Edit values in the built-in data grid, paste CSV from Excel or Google Sheets, and watch the chart rebuild live. Style colors, labels, and legends to match your brand, then embed charts directly in presentations and infographics.
How it works
- Open PictorX in your browser and load an image or start a new design.
- Choose Living charts & data from the editor tools and adjust the result to fit your composition.
- Continue editing with layers, effects, and text, then export when you are ready.
How to use the Living charts & data tool
Tell stories with numbers—not spreadsheets. PictorX keeps the tool in the same browser workspace as your layers, photos, text, and design elements, so you can refine a composition without switching applications.
Keep creating in PictorX
Use Living charts & data as one step in a complete editing workflow. Adjust the composition, add text or graphics, and keep every change editable while you turn an image into a finished design.
Frequently asked questions
Can I turn numbers into a chart?
Yes. Build editable charts for slides, reports, and one-page summaries.
Do I have to paste a screenshot of Excel?
No. Keep the chart in PictorX so you can restyle it when the numbers change.
Can a chart live on a presentation slide?
Yes. Place it on a document page or a presentation template.
Can I match chart colors to a brand?
Yes. Style fills and type to the same palette as the rest of the deck.
Related tools
Build a deck with the presentation wizard
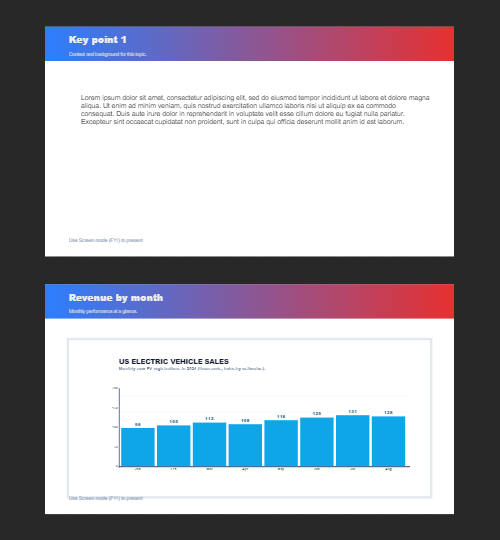
Build a deck with PictorX’s step-by-step presentation wizard, then edit every slide in the same browser workspace.
Multiple pages
Build multi-page documents in Document mode—ideal for presentations, brochures, and multi-screen layouts. Use PictorX free in your browser with no software install required.

Design templates
Jump-start any project with hundreds of ready-made layouts: artistic compositions, text and poem designs, tables, charts, infographics, illustrations, presentation slides, and more. Use PictorX free in your browser with no software install required.
Ready to try it?
Open PictorX in your browser — no install, no credit card required to start.
Use Living charts & data