
Space-filling curves explained
A line is one-dimensional and a square is two-dimensional, so it seems obvious that a line can never cover a square. In 1890 Giuseppe Peano showed that it can: there is a continuous curve that passes through every point of a square. The discovery forced mathematicians to rethink what a curve and a dimension are, and a century later the same curves keep the data of maps and images in order inside computers.
As many points as a square
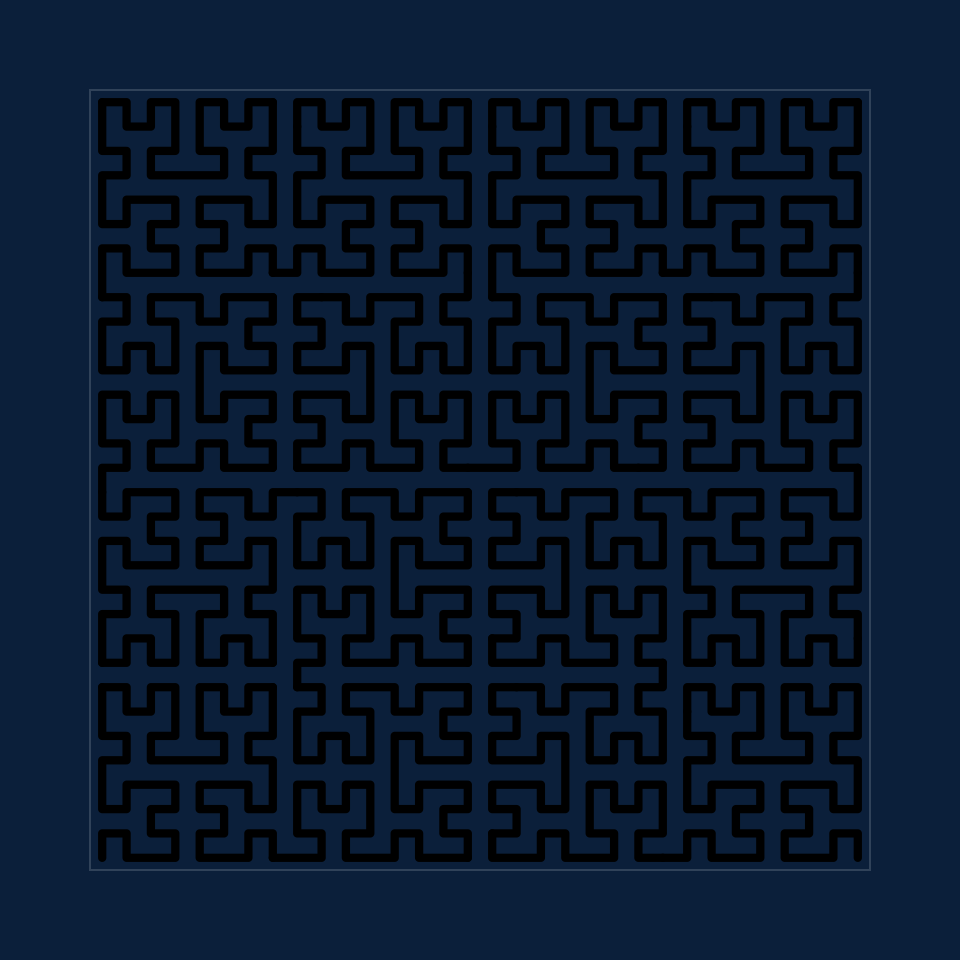
In 1877 Georg Cantor proved that a line segment has exactly as many points as a square: every point of the square can be paired with its own point of the line. He wrote to Richard Dedekind: "I see it, but I do not believe it." Cantor's pairing jumps about wildly, though; it tears the line into dust. The open question was whether a line could cover a square without being torn, that is, continuously.
Peano's curve
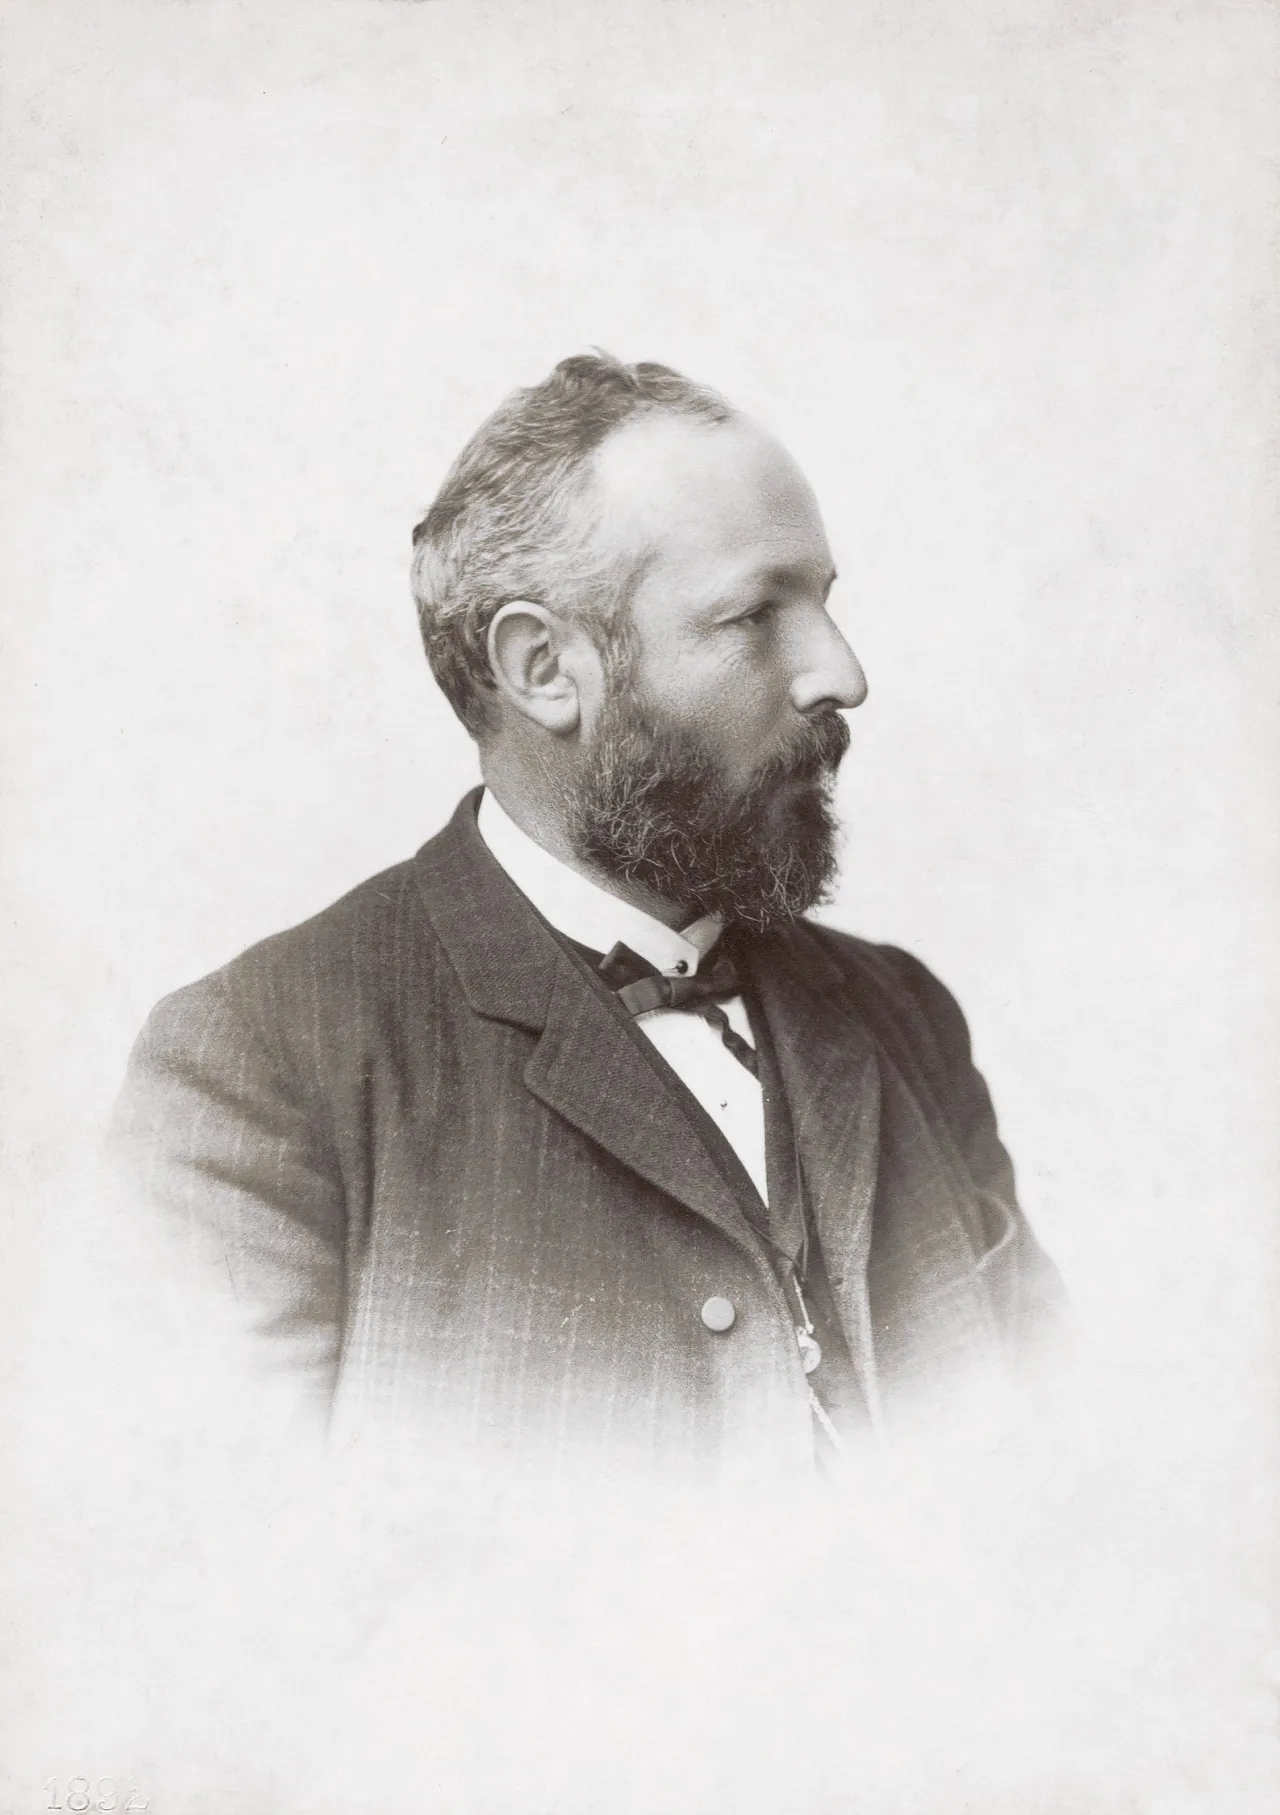
In 1890 the Italian mathematician Giuseppe Peano gave the answer: yes. He described, in formulas only and without a single picture, a continuous curve that passes through every point of the unit square. His construction cuts the square into 9 smaller squares, walks through them in S-bends, and repeats this inside each of them, again and again.
Hilbert's picture
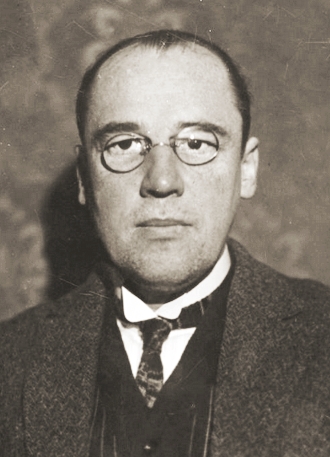
A year later David Hilbert published a simpler version, with the picture that made the idea visible. Cut the square into 4 and join the centres with one bent line. Then cut each small square into 4 and do it again, turning the small copies so that the line runs on from one to the next. The curve of level n visits 4ⁿ cells; what fills the square is the limit of all levels. In 1900 Eliakim Hastings Moore gave a variant that ends where it starts, a closed loop.
Why the limit works
Follow one point of the line, say the one a third of the way along. At level 1 it lies in one of the 4 cells. At every next level it moves, but it stays inside that cell, and then inside a quarter of it, and so on: inside a cell whose side halves each time. So its position settles down, and the same holds for every point of the line. The limit is a continuous curve. And because every level visits every cell of an ever finer grid, the limit curve comes as close as you like to every point of the square and, being continuous, reaches it.
It cannot be done one-to-one
A space-filling curve has to pay a price. In 1879 Eugen Netto proved that a line cannot be mapped onto a square continuously and one-to-one at the same time. So the curve must pass through some points more than once; Hilbert's curve touches some points up to four times. It is also nowhere smooth: at no point does it have a tangent.
Length and dimension
Level n of Hilbert's curve is 2ⁿ − 2⁻ⁿ times as long as the side of the square, about twice as long as the level before. The length has no limit, yet the curve never leaves the square. A curve made of 4 copies of itself at half the size has dimension log 4 / log 2 = 2, the dimension of the square it fills. Peano's curve has 9 copies at a third of the size: log 9 / log 3 = 2 as well.
Keeping neighbours together
Hilbert's curve has a property that makes it useful: points that are close together on the line end up close together in the square. The reverse cannot always hold: two neighbouring cells can be far apart on the line. Computers use the curve to store two-dimensional data, such as map tiles, pixels or places on the globe, in a one-dimensional order that keeps most neighbours near each other. The Z-order, described by Guy Morton at IBM in 1966, does the same job by interleaving the bits of the two coordinates. It is faster to compute, but it keeps neighbours together less well, because it jumps.
Gosper's flowsnake and Sierpiński's arrowhead
Not every space-filling curve fills a square. Bill Gosper's curve of 1973, known as the flowsnake since Martin Gardner wrote about it in 1976, runs over a grid of triangles with seven segments for each one. It fills the Gosper island, a shape with a fractal coastline, seven copies of which fit together into a larger one. Wacław Sierpiński's arrowhead curve looks similar at first, but it has only three pieces per segment at half the size and therefore fills nothing: it traces the Sierpiński triangle, of dimension log 3 / log 2 ≈ 1.585.
Explore it
Open the space-filling curve explorer and press Play to watch a pen draw each level of Hilbert's curve from start to end. Switch to Peano's S-bends, Moore's closed loop, the jumping Z-order, Gosper's flowsnake and the arrowhead. Put the pen anywhere on the curve, or on the number line under the picture, to see which step lands in which cell, and show the level before to see how every step turns into a whole bend.
Frequently asked questions
Who discovered the first space-filling curve?
Giuseppe Peano, in 1890. That is why space-filling curves are also called Peano curves. David Hilbert's curve of 1891 is the best known, because Hilbert was the first to draw a picture of the construction.
Is a space-filling curve a fractal?
It is built like one, from smaller copies of itself. But its fractal dimension is 2, a whole number, because the finished curve covers an area. The Sierpiński arrowhead curve, with a dimension of about 1.585, is a fractal in the usual sense.
How long is the Hilbert curve?
Level n is 2ⁿ − 2⁻ⁿ times the side of the square: 1.5 at level 1, 15.94 at level 4 and almost 256 at level 8. The limit curve is infinitely long.
How many levels can the explorer draw?
Up to 8 levels for the Hilbert curve, the Moore curve and the Z-order, which is a grid of 256 by 256 cells; 5 for the Peano curve (243 by 243 cells) and the Gosper curve (16,807 segments); and 10 for the Sierpiński arrowhead (59,049 segments).
Related tools
Space-filling curve explorer
Watch the Hilbert, Peano and Moore curves fill a square one level at a time. Move a pen along the curve to see how a line maps onto a plane, and compare the Z-order, the Gosper curve and the Sierpiński arrowhead.
Dragon curve generator
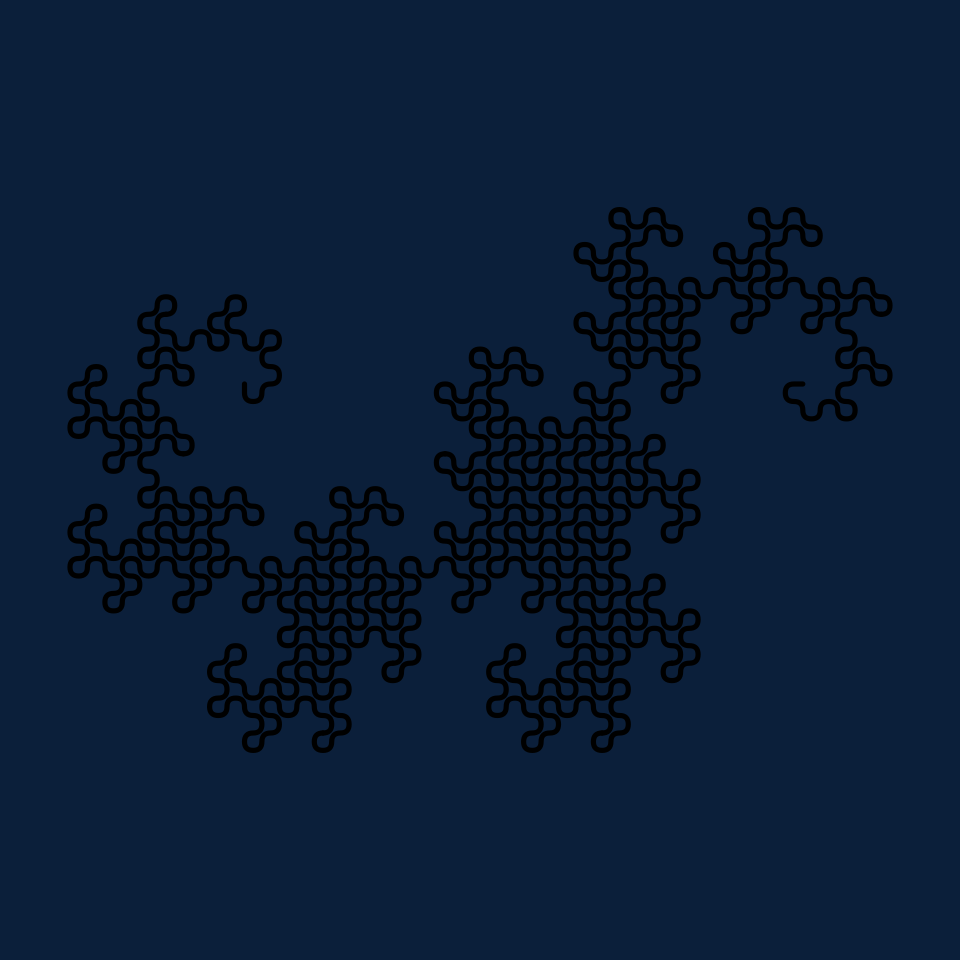
Fold a strip of paper again and again and watch it unfold into the Heighway dragon. Grow it level by level, try the twin dragon, the terdragon and the Lévy C curve, and see a curve that fills an area without crossing itself.
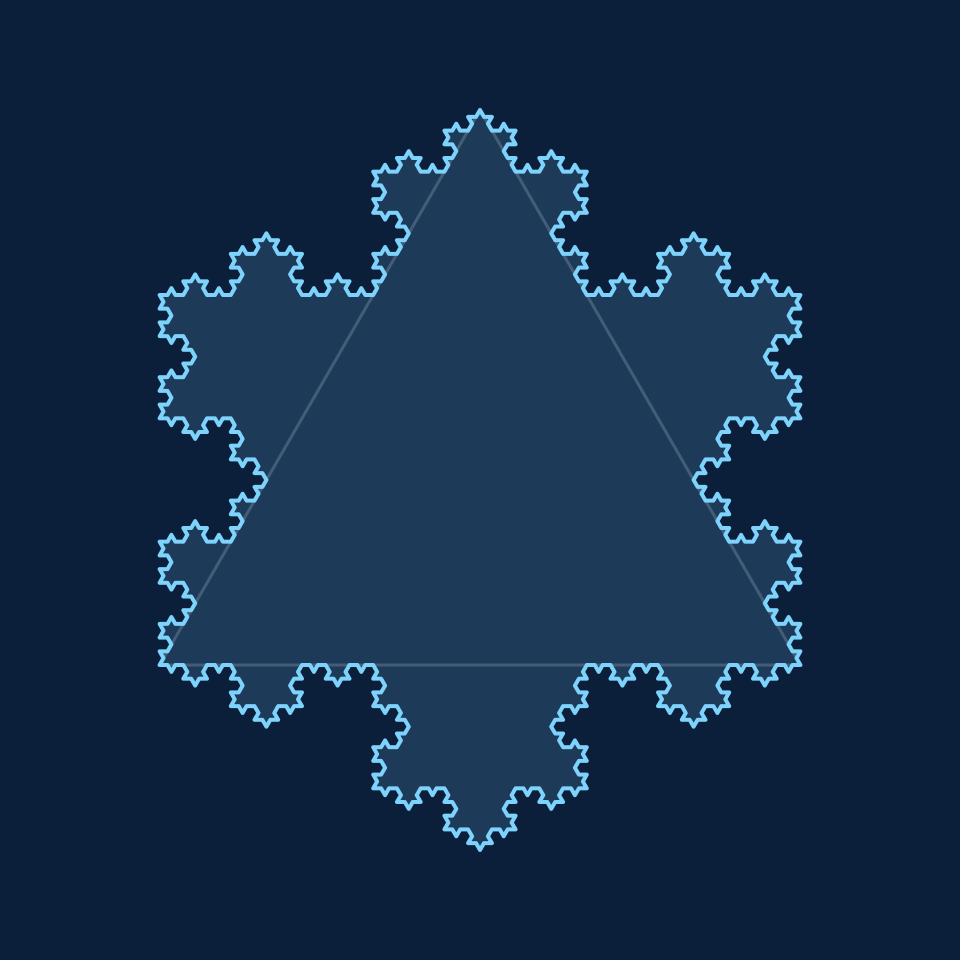
Koch snowflake generator
Grow the Koch snowflake level by level and see its perimeter grow by 4/3 each time while the area settles at 8/5. Try the anti-snowflake, Cesàro angles, square bumps and the Minkowski sausage.
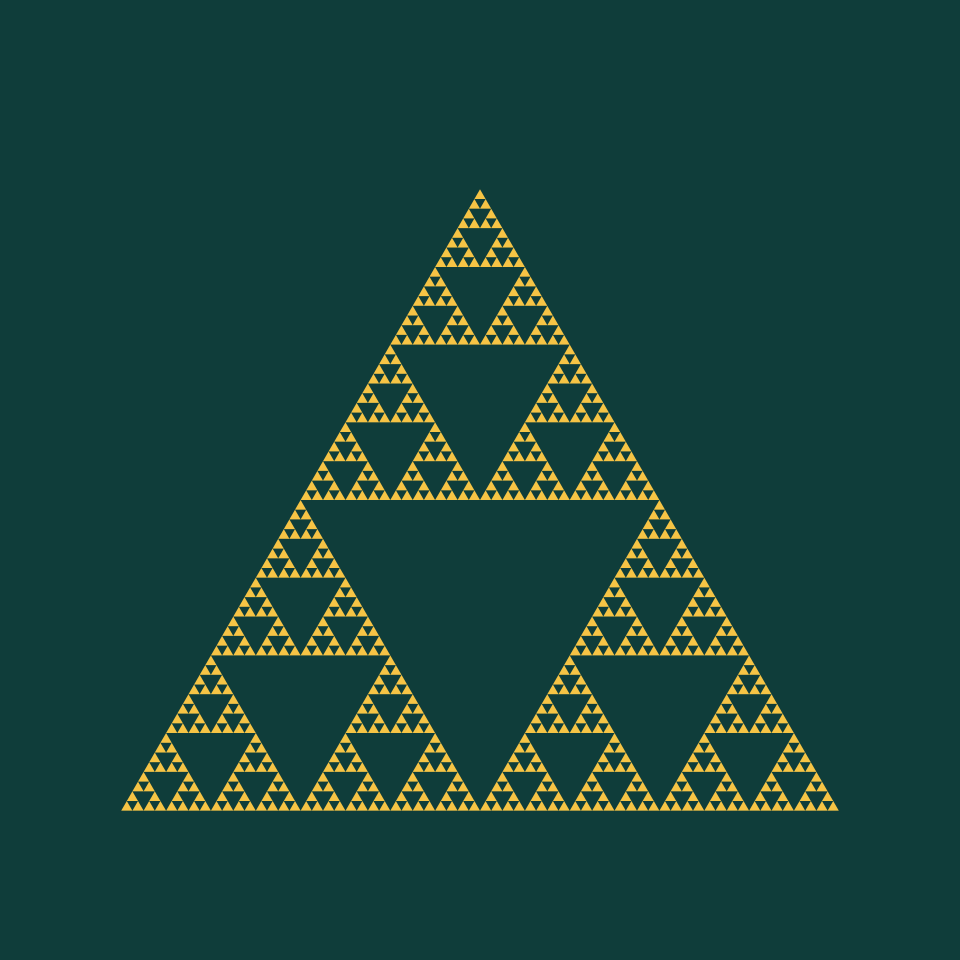
Sierpiński triangle builder
Build the Sierpiński triangle by removing middles, by the chaos game or from Pascal's triangle mod 2. Try other corners, jumps and rules, and see area, triangles and the fractal dimension 1.585.
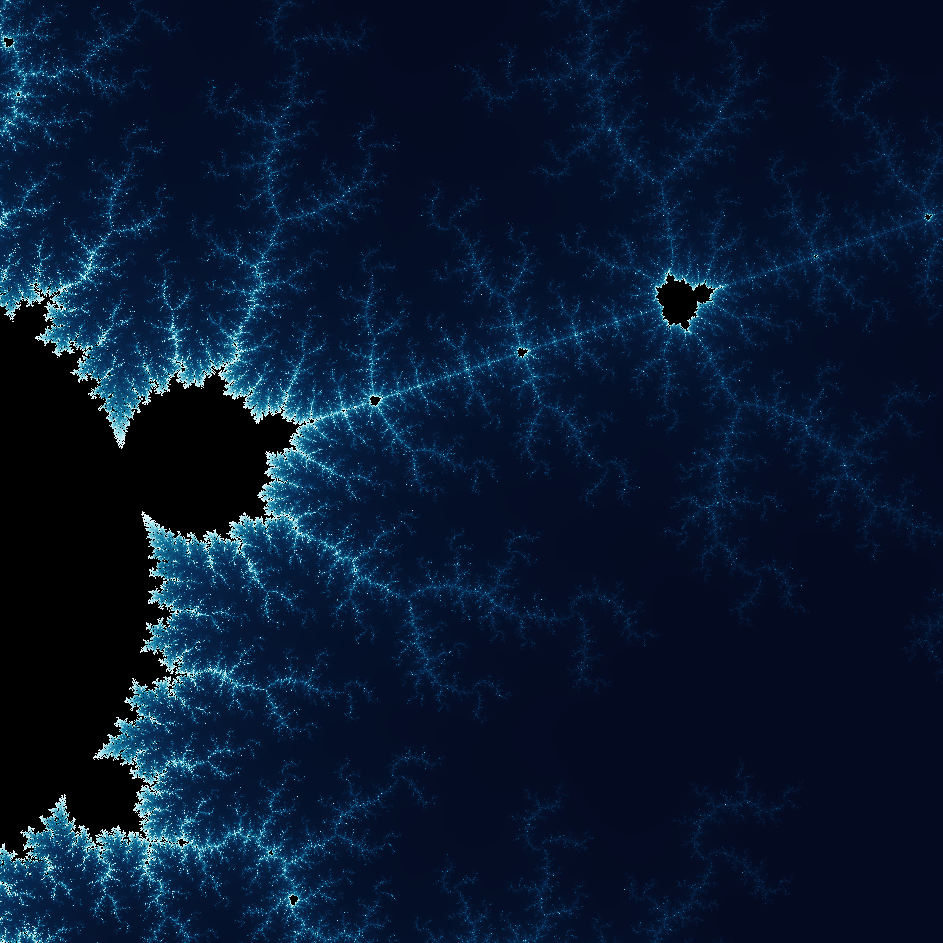
Fractal generator: zoom into Mandelbrot, Julia and Newton fractals
Free online fractal generator: zoom about 5 trillion times into the Mandelbrot set, Julia and Newton fractals, jump to 64 famous spots and save a PNG.
Ready to try it?
Open PictorX in your browser — no install, no credit card required to start.
Open the space-filling curve explorer