
Lyapunov fractals explained
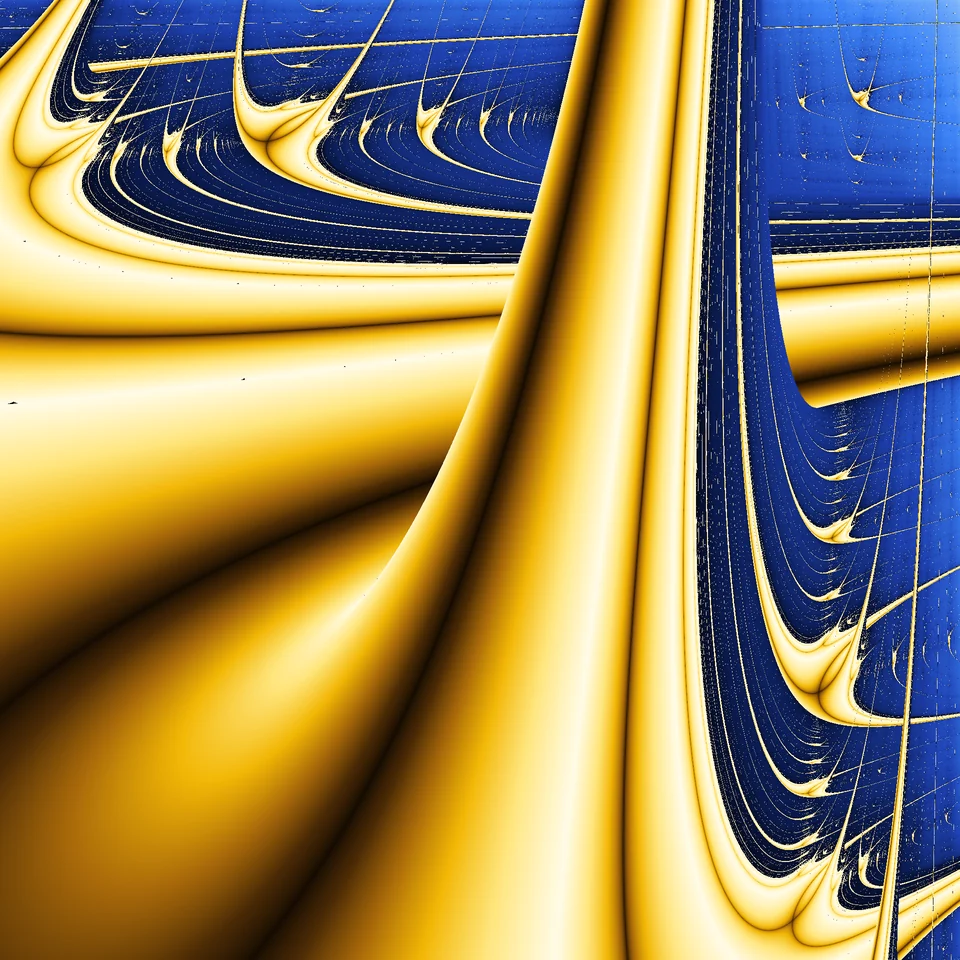
Most fractals are drawn by asking where a point ends up. A Lyapunov fractal asks a different question: if you nudge the start a little, does the nudge die out or does it grow? The answer is one number, the Lyapunov exponent, and colouring a plane by that number gives pictures that look like polished metal bands crossing over a dark, grainy sea. Behind them is one of the simplest equations in science, the logistic map, pushed back and forth between two growth rates.
The logistic map
Take a population x, written as a share of the largest population its habitat can feed, so x lies between 0 and 1. Next year's population is r·x·(1 − x): the more animals, the more offspring, but the fuller the habitat, the less food for each. The biologist Robert May made this equation famous in 1976 by showing how much it hides. For a growth rate r below 1 the population dies out, and between 1 and 3 it settles on the value 1 − 1/r. At r = 3 that value becomes unstable and the population alternates between two values, at about 3.449 between four, then eight, sixteen and so on, each doubling coming sooner than the last. At about 3.57 the doublings pile up and chaos begins: the population never repeats, although the rule has no chance in it. Even then order returns in narrow windows, such as the cycle of three values near r = 3.83.
The Lyapunov exponent
The Russian mathematician Aleksandr Lyapunov studied the stability of motion in the 1890s: when does a small disturbance stay small? For the logistic map the answer can be computed. One step multiplies a small difference between two populations by |r·(1 − 2x)|, the slope of the map at x. The Lyapunov exponent λ is the average of the logarithm of that factor over a long orbit. At r = 2.5 the population settles at 0.6, where the slope is −0.5, so every step halves the difference and λ = ln 0.5 ≈ −0.69. At r = 4 the exponent is ln 2 ≈ +0.69: the difference doubles with every step on average, and a start value known to ten decimals is worthless after about 33 steps. Negative means order, positive means chaos, and zero is the border, reached exactly where one cycle gives way to another.
Two growth rates and a sequence
In the late 1980s the physicist Mario Markus, working at a Max Planck institute in Dortmund, asked what happens when the growth rate is not constant but forced back and forth, as it is for a population that lives through good and bad seasons. He let r switch between two values, a and b, in the order of a fixed sequence of letters: AB alternates them, AAB uses a twice and then b once. With two numbers to choose, every choice is a point in a plane, with a along the horizontal axis and b along the vertical one. Computing the Lyapunov exponent for every point and colouring the plane by it gives the Lyapunov fractal. The plane is sometimes called Lyapunov space.
Reading the picture
The bright areas are order. There the exponent is negative, and the population ends in a cycle whatever small disturbance it meets. The colour darkens as the cycle gets more stable, down to thin dark curves where the exponent drops to minus infinity. Those are the superstable orbits, which pass through x = ½, the top of the parabola, where the slope is zero. The dark, grainy areas are chaos, with a positive exponent. Along the diagonal a equals b, and the picture repeats the story of the single logistic map: one value, two, four, chaos, and the windows of order inside it. Away from the diagonal the bands bend, cross and end in sharp points.
Swallows and crossing bands
The islands of order inside the chaos have a shape of their own, a body with two swept wings, and are often called swallows. Around every swallow there are smaller ones, and zooming in keeps finding more, which is what earns the picture the name fractal. Where two bands cross, one seems to pass over the other. Nothing is hidden there: for those values of a and b the map has two stable cycles at once, and the start value decides which of them the orbit finds, and so which band is drawn on top. Starting every orbit at x = 0.5 with the first letter of the sequence also breaks the symmetry between the letters, so the picture of BA is the mirror image of AB in the diagonal, not the same picture.
From a laboratory to home computers
Markus published the method with Benno Hess in 1989 and gave some of his pictures names. The best known is Zircon Zity, the sequence BBBBBBAAAAAA with a between 3.4 and 4 and b between 2.5 and 3.4, where the bands stand like towers. In September 1991 A. K. Dewdney described the pictures in his column in Scientific American, under the title Leaping into Lyapunov Space, and readers with home computers started to draw their own. They needed patience: every point of the picture takes hundreds of steps of the map, and a picture has hundreds of thousands of points.
How the picture is computed
For each point the app starts the population at x₀ = 0.5 and first lets the map run without measuring, so that the orbit can settle. Then it runs the number of steps you set as iterations and averages the logarithm of the slope. A picture of 600 by 600 points with 200 iterations takes about a hundred million steps of the map, which a browser does in under a second. The estimate is rough near the border of chaos, where orbits settle slowly, and that shows as speckles. More iterations remove them. The picture is drawn in passes, every eighth point first, so a zoom or a move shows a coarse picture at once and sharpens as you watch.
Explore it
Open the Lyapunov fractal to type any sequence of up to 24 letters, or start from an example such as AB, AABAB or Zircon Zity. Scroll, pinch or double-click to zoom in, down to a window a billionth of a unit wide, and drag to move. Click a point to mark it: the tiles show its Lyapunov exponent, whether it is stable, superstable or chaotic and how long its cycle is, and the chart draws the first 64 steps of its orbit, coloured by the letter that made each step. Another tile gives the share of the window that is chaotic. Choose from five colour schemes, change the start value to find the places with two cycles, and save the picture, a PDF or the settings.
Frequently asked questions
Is a Lyapunov fractal really a fractal?
Not in the strict sense of a shape built by repeating one rule at ever smaller scales, like the Koch snowflake, and it has large smooth areas. But the border between order and chaos has detail at every scale, and the swallows return in ever smaller copies, so the name has stuck.
What does a Lyapunov exponent of zero mean?
The orbit is on the edge: a small disturbance neither dies out nor grows on average. That happens exactly at a bifurcation, where one cycle gives way to a cycle of twice the length, and at the border of chaos.
Why does the plane stop at 4?
For growth rates from 0 to 4 the population stays between 0 and 1. Above 4 it can jump out of that range, and from there it runs off to minus infinity, so there is no orbit left to measure.
Can other maps be used?
Yes. Any map with a parameter that can switch between two values gives a picture of this kind. The logistic map is the classic choice because it is the simplest map that goes all the way from order to chaos, and it is the one this app draws.
Related tools
Lyapunov Fractal
Draw Lyapunov fractals in your browser: type a sequence such as AB or BBBBBBAAAAAA, zoom into the swallows of Zircon Zity, and see where the logistic map is stable and where it is chaotic.
Fractal generator: zoom into Mandelbrot, Julia and Newton fractals
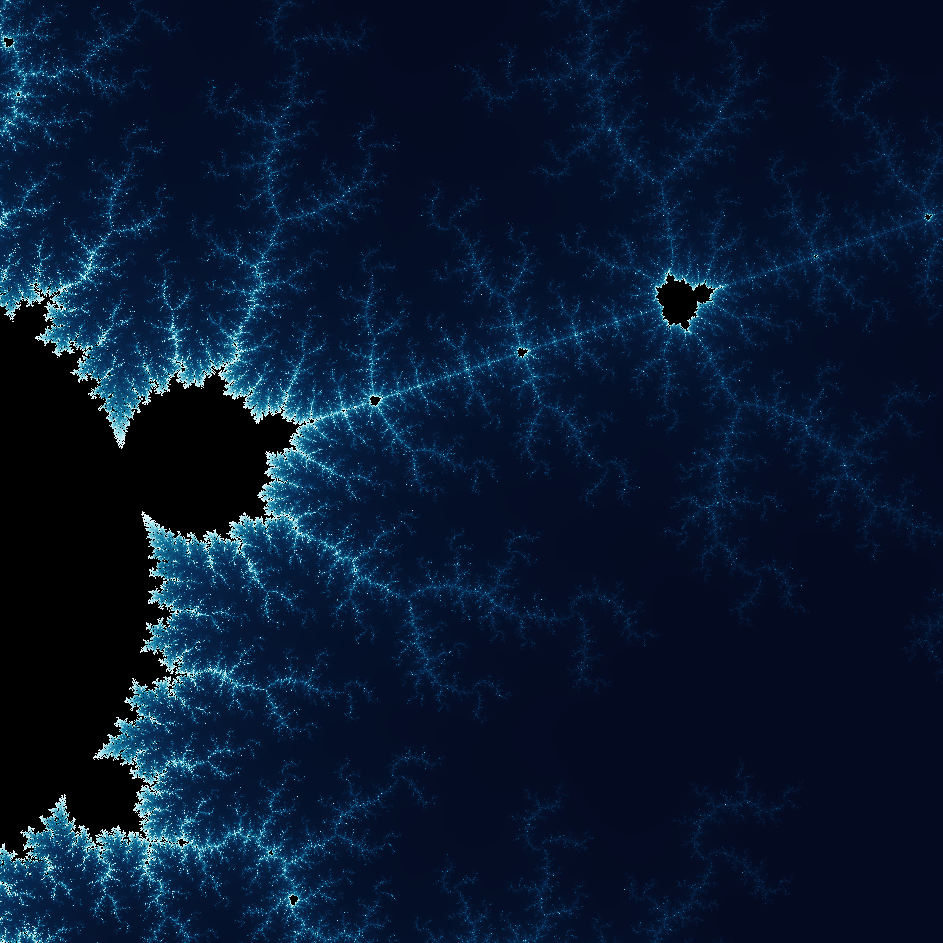
Free online fractal generator: zoom about 5 trillion times into the Mandelbrot set, Julia and Newton fractals, jump to 64 famous spots and save a PNG.
Sandpile Fractal
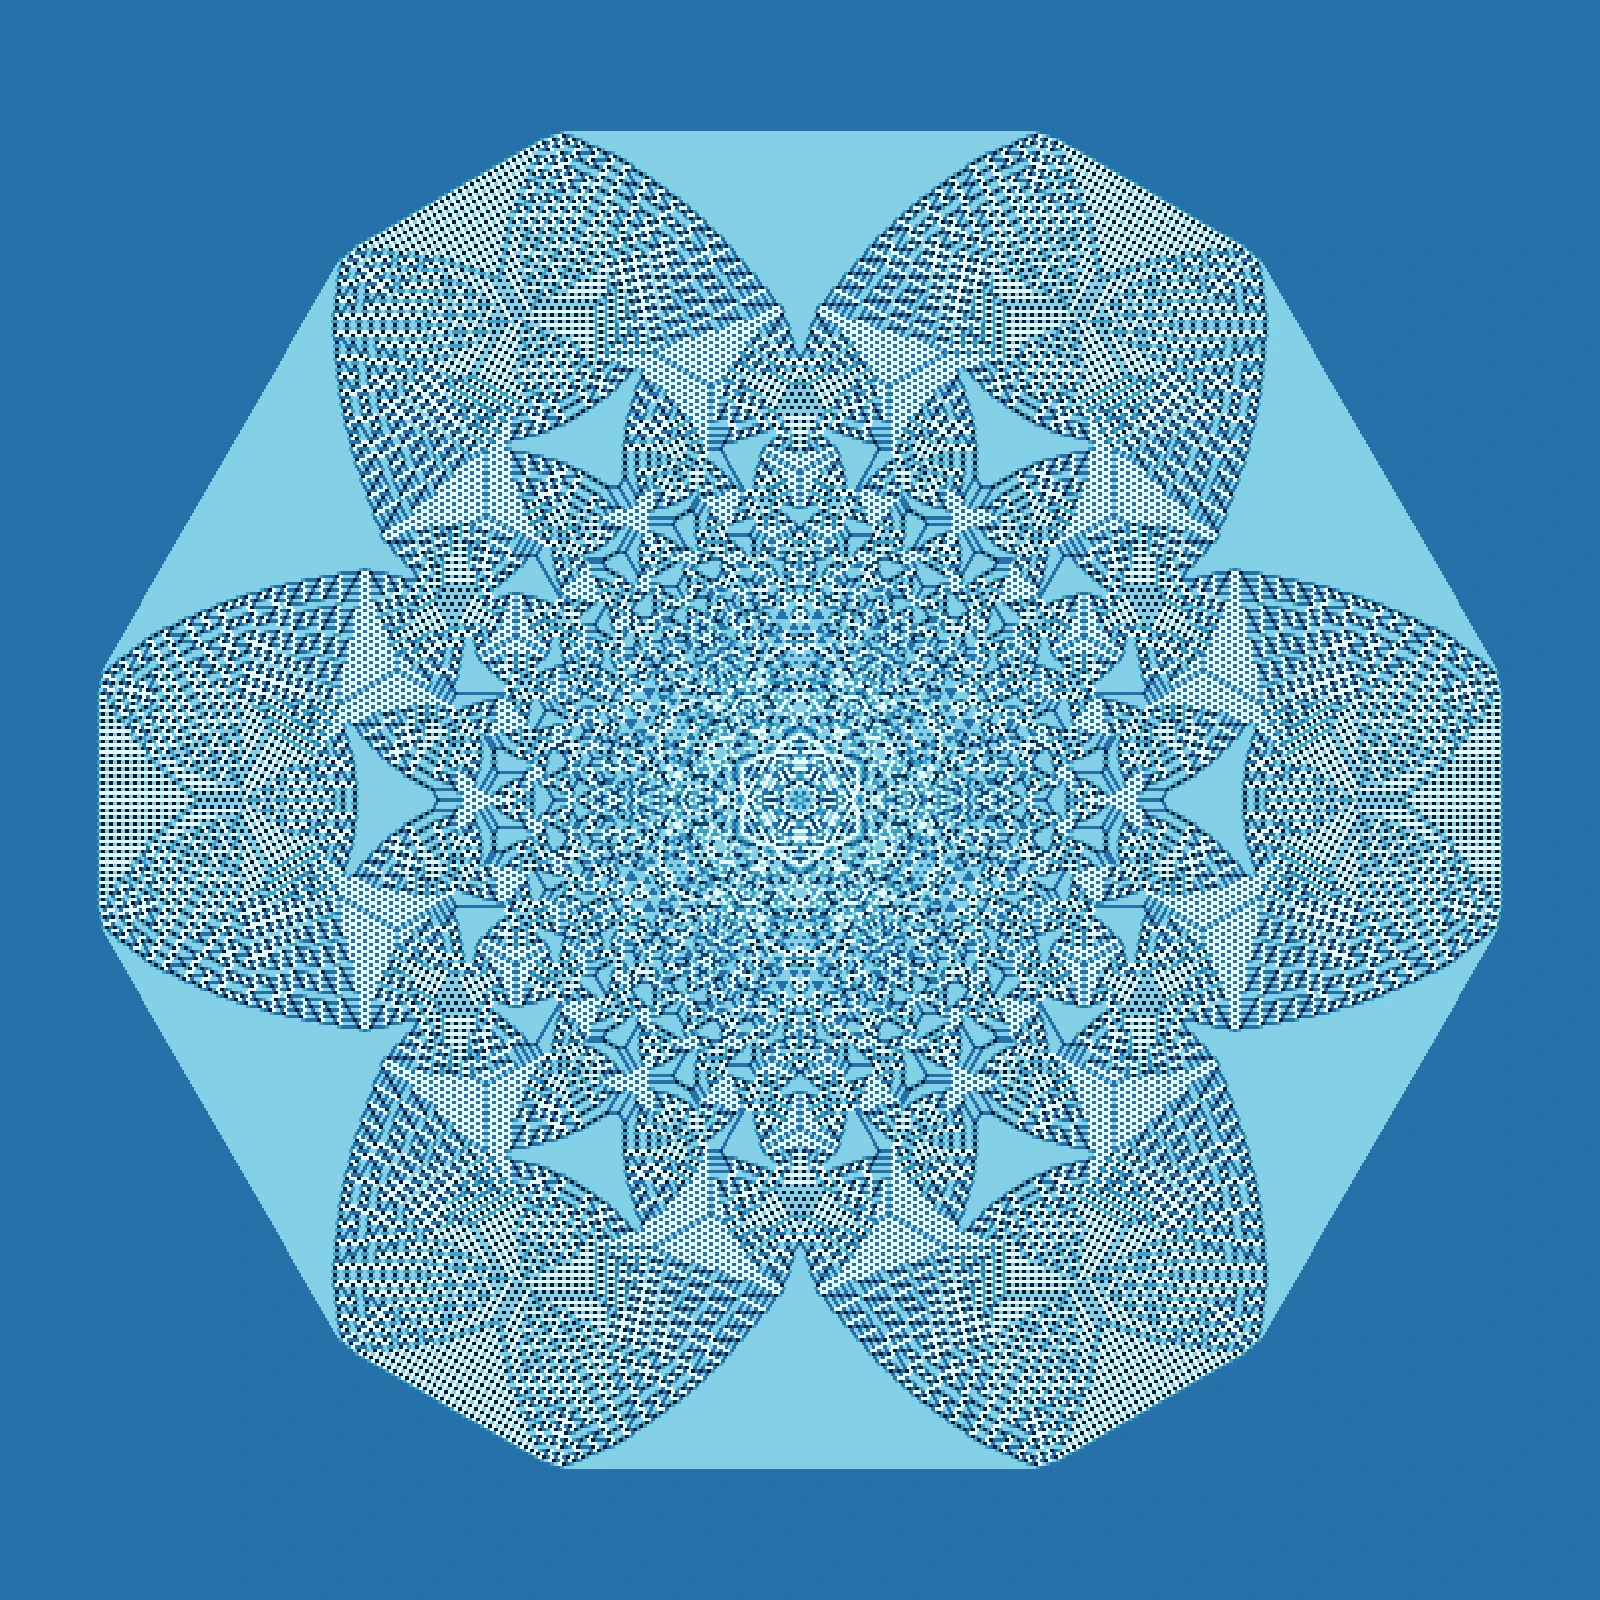
Drop up to a million grains of sand on one cell and watch them topple into a fractal. Square, diagonal and triangular lattices, the identity of the sandpile group, and avalanches.
Magnetic pendulum
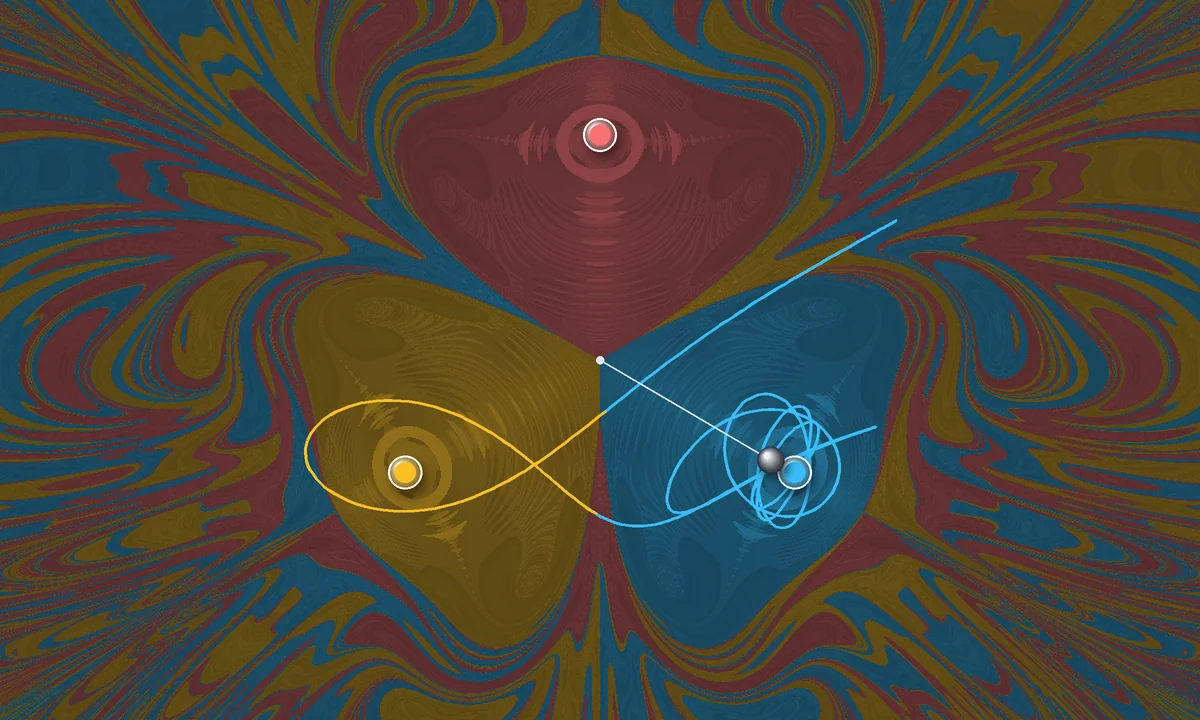
Let an iron bob swing over three magnets and see where it comes to rest. Color every starting point by its magnet and a fractal appears. Drag the magnets and save a PNG.
Double Pendulum
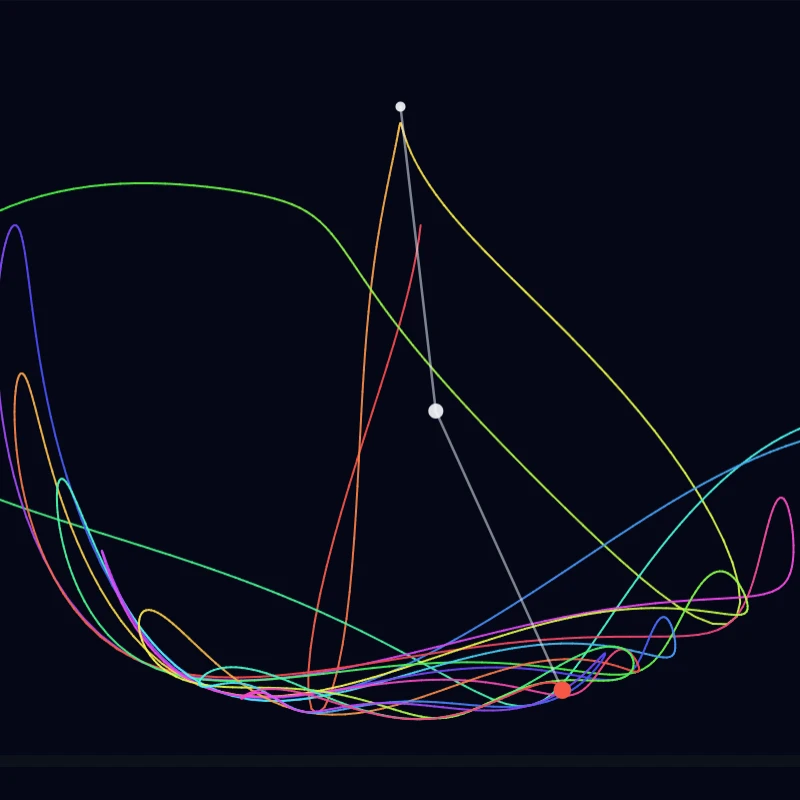
Simulate a classical double pendulum in your browser. Paint chaotic tip trails, long-exposure paths, or distort a soft field—then save a PNG.
Ready to try it?
Open PictorX in your browser — no install, no credit card required to start.
Open the Lyapunov fractal