
Orbit of the marked point
- A: r = a
- B: r = b
Lyapunov Fractal
A population that grows well in one season and badly in the next can settle into a steady rhythm, or never repeat itself at all. The Lyapunov fractal is the map of that choice. It takes the logistic map, the simplest model of a population with limited room, and lets its growth rate switch between two values, a and b, in a fixed order such as AB or AABAB. Every point of the picture is one pair (a, b), coloured by its Lyapunov exponent: bright where the population settles into a cycle, dark where it turns chaotic. Type a sequence, zoom into the swallow-shaped islands of order, and click any point to see its orbit. Type a sequence of the letters A and B, or pick an example. Every point of the picture is a pair of growth rates: a runs from left to right, b from bottom to top. The bright colours are order, the dark ones chaos. Scroll or pinch to zoom, drag to move and double-click to zoom in; the buttons in the corner zoom and bring back the starting window, and the arrow keys, + and − work too. Click a point to mark it: the tiles show its Lyapunov exponent, and the chart the first 64 steps of its orbit. More iterations give a sharper picture and take longer. Undo steps back through the windows you visited.
How it works
- Type a sequence of the letters A and B, such as AB, AABAB or BBBBBBAAAAAA, or pick an example like Zircon Zity.
- Zoom in with the mouse wheel, a pinch or a double-click and drag to move, and raise the iterations for a sharper picture deep inside the fractal.
- Click a point to read its Lyapunov exponent and follow its orbit in the chart, then choose the colours and save the picture.
From one map to a plane
The logistic map turns a population x, measured as a share of the most its habitat can carry, into next year's population r·x·(1 − x). For a growth rate r between 1 and 3 the population settles on one value. Above 3 it starts to alternate between two values, then four, then eight, and beyond r ≈ 3.57 it mostly wanders without ever repeating. A Lyapunov fractal uses two growth rates instead of one. A sequence such as AAB says in which order they take turns: two steps with a, one with b, and again from the start. The horizontal axis is a and the vertical axis is b, so the diagonal, where a equals b, is the ordinary logistic map.
What the colours mean
The Lyapunov exponent λ measures what happens to two populations that start almost equal. Each step stretches or shrinks their difference by the factor |r·(1 − 2x)|, and λ is the average of the logarithm of that factor along the orbit. When λ is negative the difference dies out: the orbit is stable and ends in a cycle, drawn in the bright colours, darker as the cycle gets more stable. The darkest thin lines are superstable orbits, which pass through x = ½, where the factor is zero. When λ is positive the difference keeps growing until the two populations have nothing in common. That is chaos, drawn in the dark colours, which brighten as λ grows. The sharp edge between the two is where λ = 0.
Why the same shapes return
Zoom into the dark sea of chaos and bright islands appear, shaped like swallows with a body and two swept wings, and around every swallow there are smaller ones. Each island is a window of order in which the population follows a cycle of a certain length. Crossing its edge, the cycle doubles again and again and dissolves into chaos, just as it does along the diagonal. Where two bands seem to cross, one passing over the other, two different cycles are stable at once and the start value decides which one the orbit finds. That is also why AB and BA are not the same picture: they are mirror images in the diagonal.
Frequently asked questions
What is a Lyapunov fractal?
A picture of where a system is stable and where it is chaotic. In the classic version the system is the logistic map, with a growth rate that switches between two values a and b in the order of a sequence of the letters A and B. Each point (a, b) of the plane is coloured by its Lyapunov exponent. They are also called Markus–Lyapunov fractals, after Mario Markus, who drew the first ones in the late 1980s.
What does the sequence do?
It sets the order in which the two growth rates take turns. AB alternates them; AABAB uses a twice, b once, a once and b once, and then starts over. Another sequence gives another picture, and longer sequences give finer structures. A sequence with only one letter is the ordinary logistic map and gives plain stripes.
What is Zircon Zity?
The name Mario Markus gave to one of his best-known pictures: the sequence BBBBBBAAAAAA, with a between 3.4 and 4 and b between 2.5 and 3.4. Its bright bands rise like the towers of a city. The example in the app shows a square part of that window.
Why are there speckles in the chaotic areas?
The exponent is estimated from a limited number of steps. Inside chaos and near its edge a short orbit gives a noisy estimate, so single points land on the wrong side of zero. Raising the iterations from 200 to 1,000 or 5,000 smooths them out, at the cost of time. Deep zooms need more iterations than the whole picture.
Why does the start value matter?
For some pairs (a, b) two different cycles are stable at once, and the orbit ends in one or the other depending on where it starts. The usual start is x₀ = 0.5, the top of the logistic parabola. Change it and some bands move or vanish, which shows where the map has two attractors.
Related tools
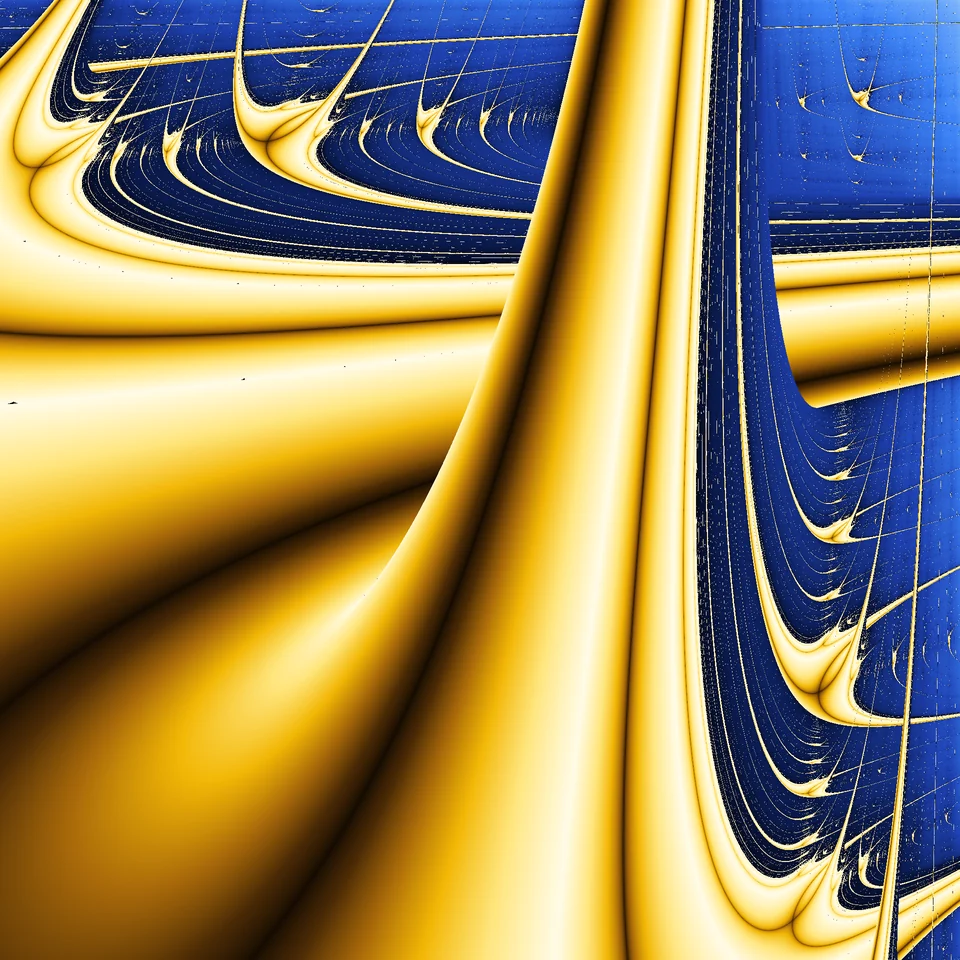
Lyapunov fractals explained
How a Lyapunov fractal is made: the logistic map, the Lyapunov exponent, a growth rate that switches between two values, and why the picture is full of swallows.
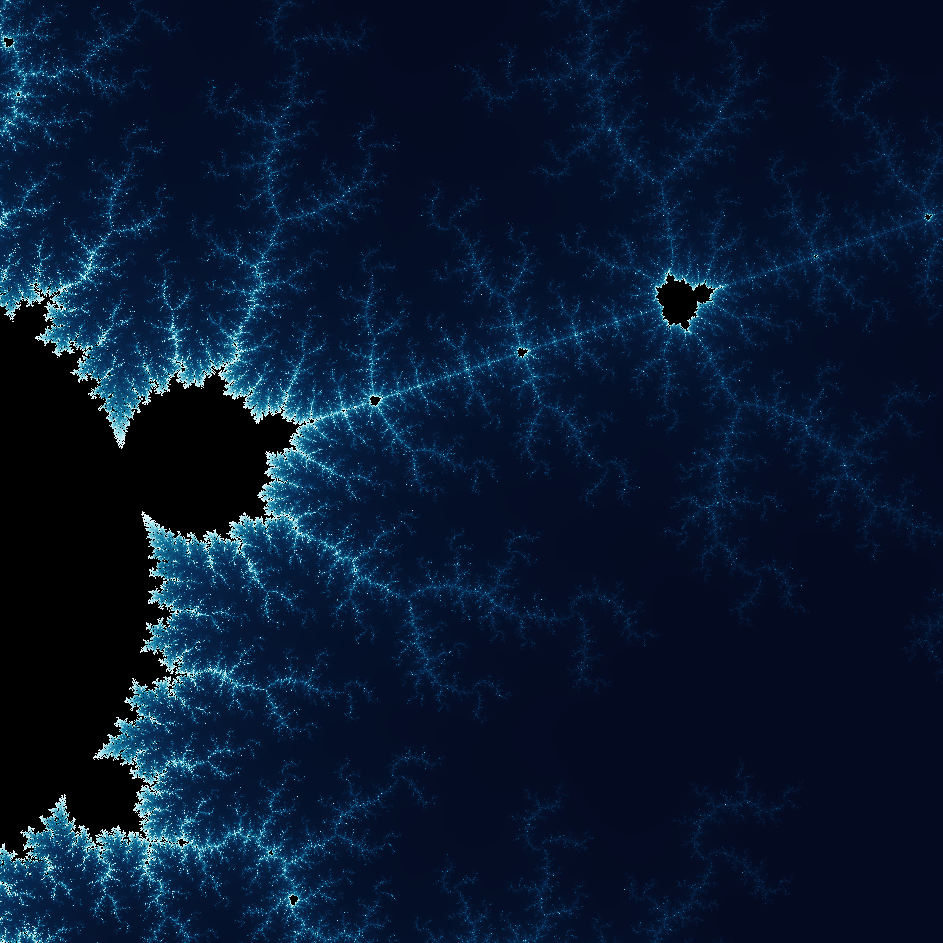
Fractal generator: zoom into Mandelbrot, Julia and Newton fractals
Free online fractal generator: zoom about 5 trillion times into the Mandelbrot set, Julia and Newton fractals, jump to 64 famous spots and save a PNG.
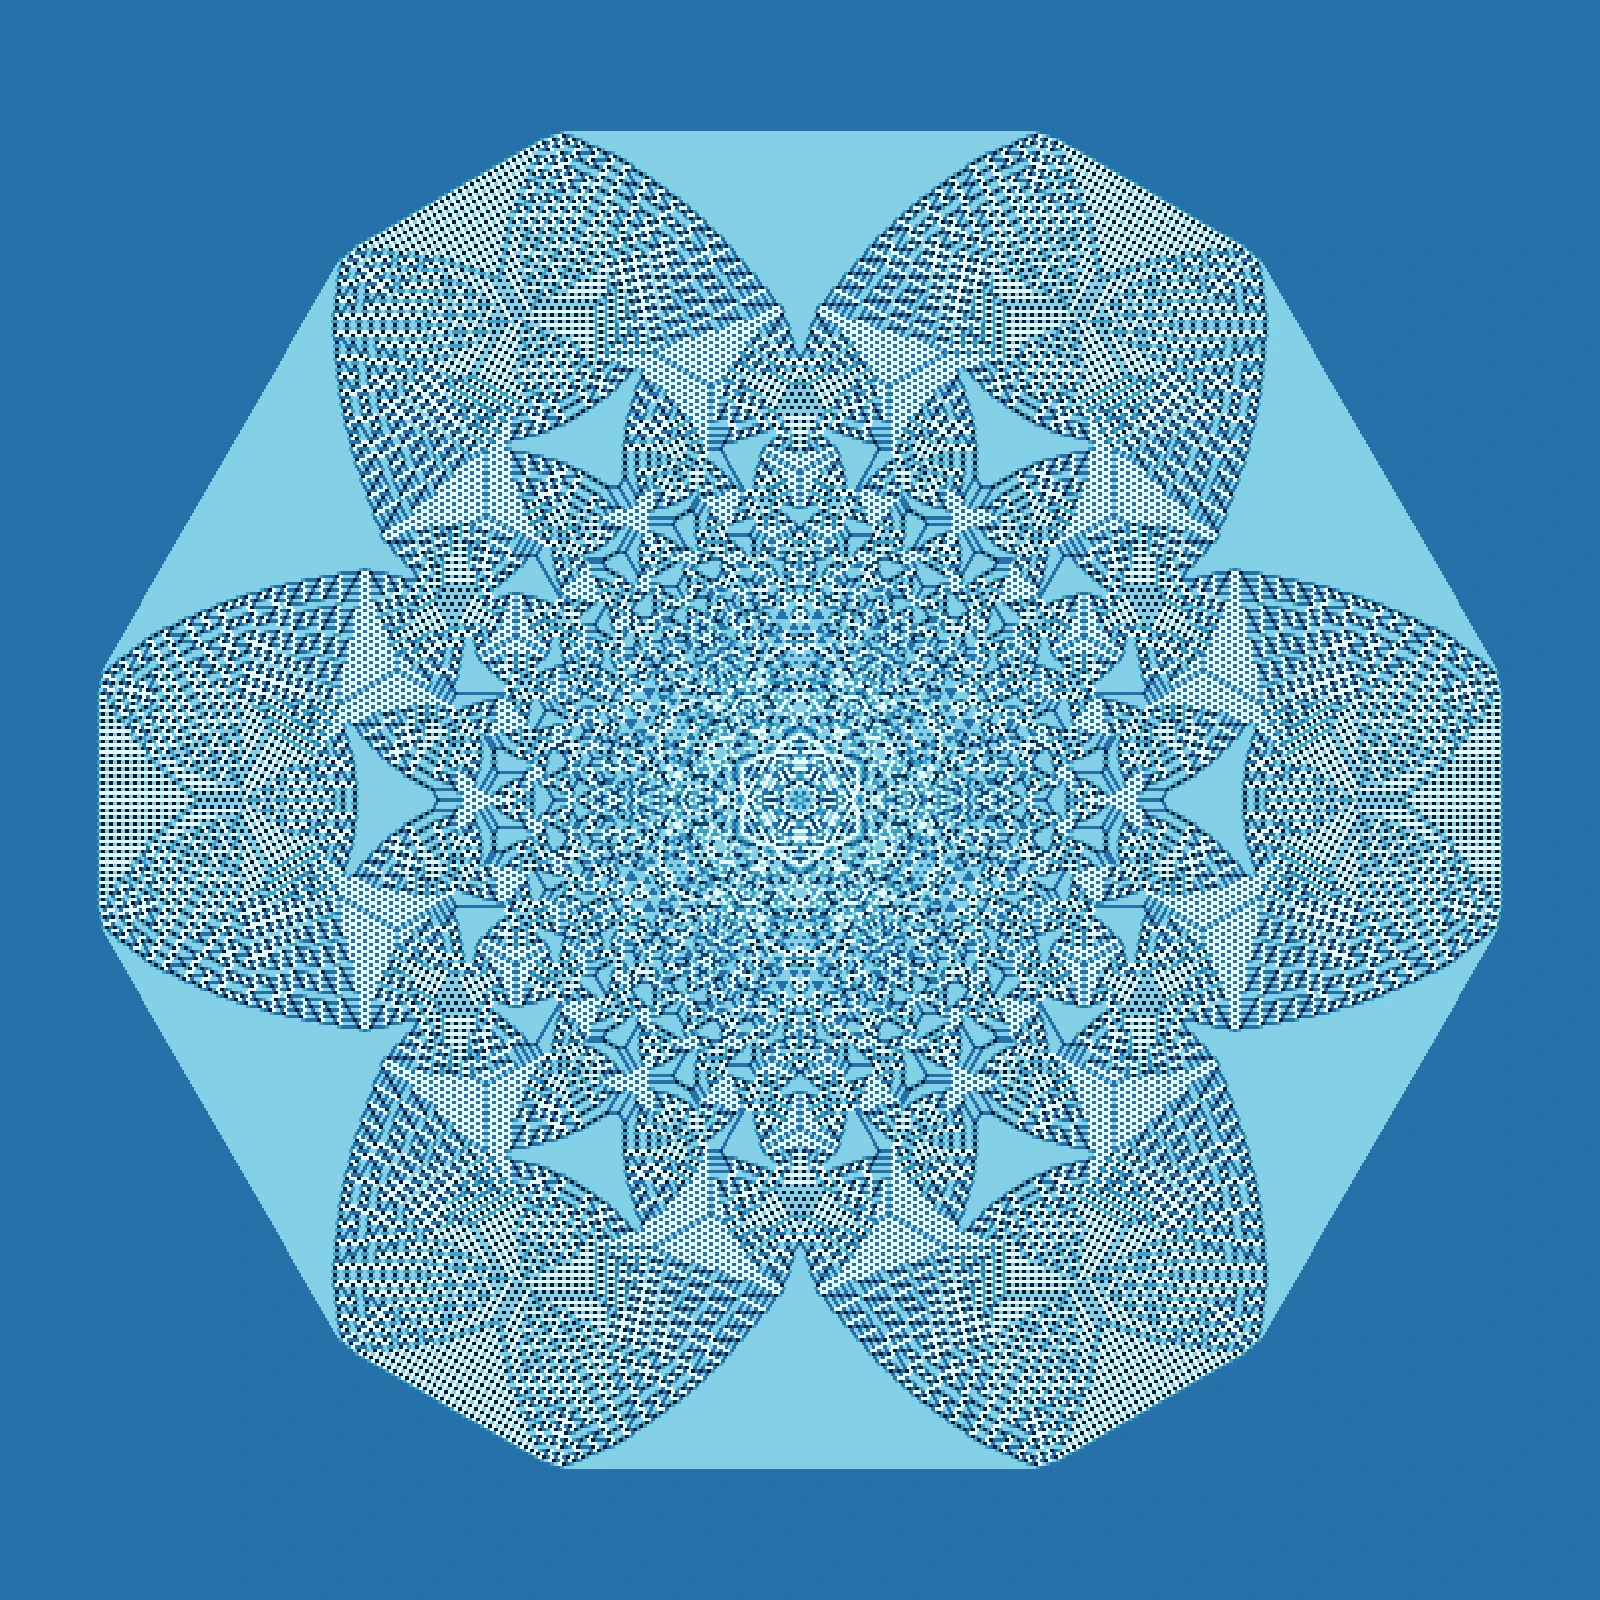
Sandpile Fractal
Drop up to a million grains of sand on one cell and watch them topple into a fractal. Square, diagonal and triangular lattices, the identity of the sandpile group, and avalanches.
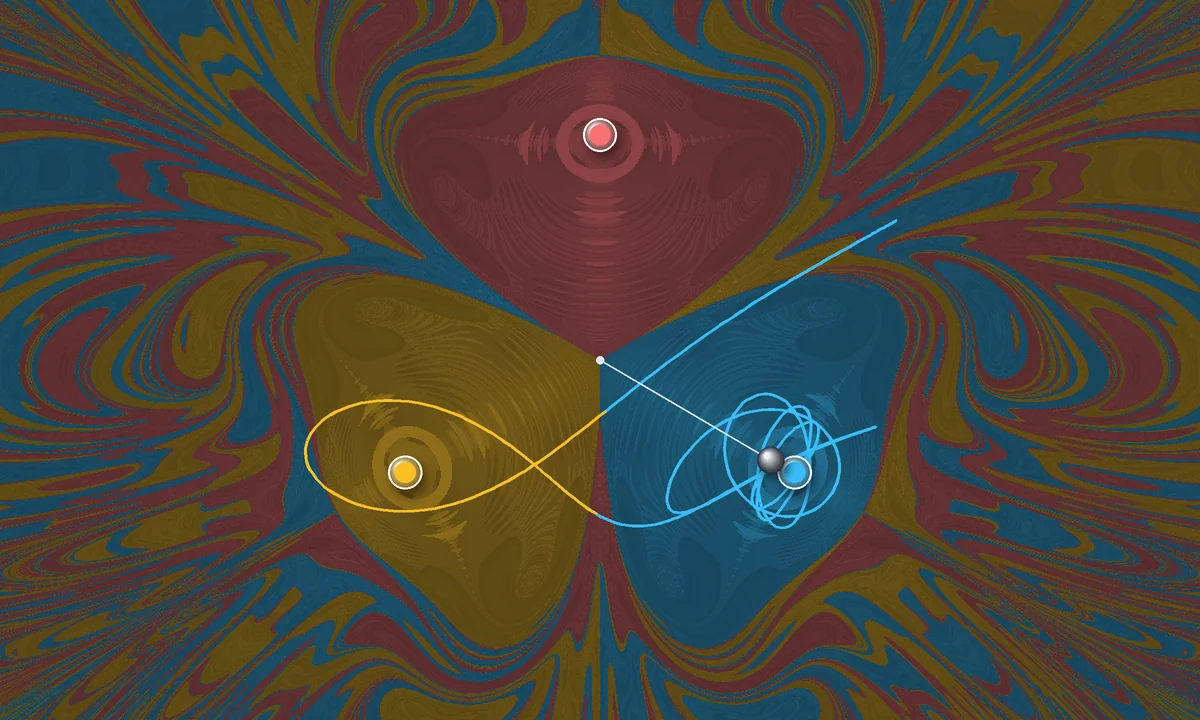
Magnetic pendulum
Let an iron bob swing over three magnets and see where it comes to rest. Color every starting point by its magnet and a fractal appears. Drag the magnets and save a PNG.
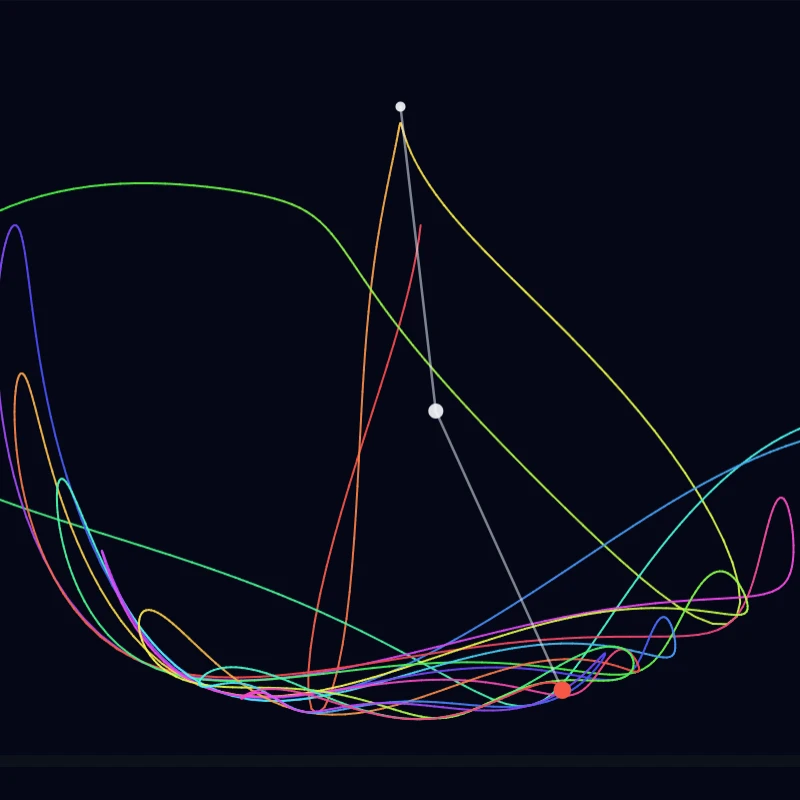
Double Pendulum
Simulate a classical double pendulum in your browser. Paint chaotic tip trails, long-exposure paths, or distort a soft field—then save a PNG.
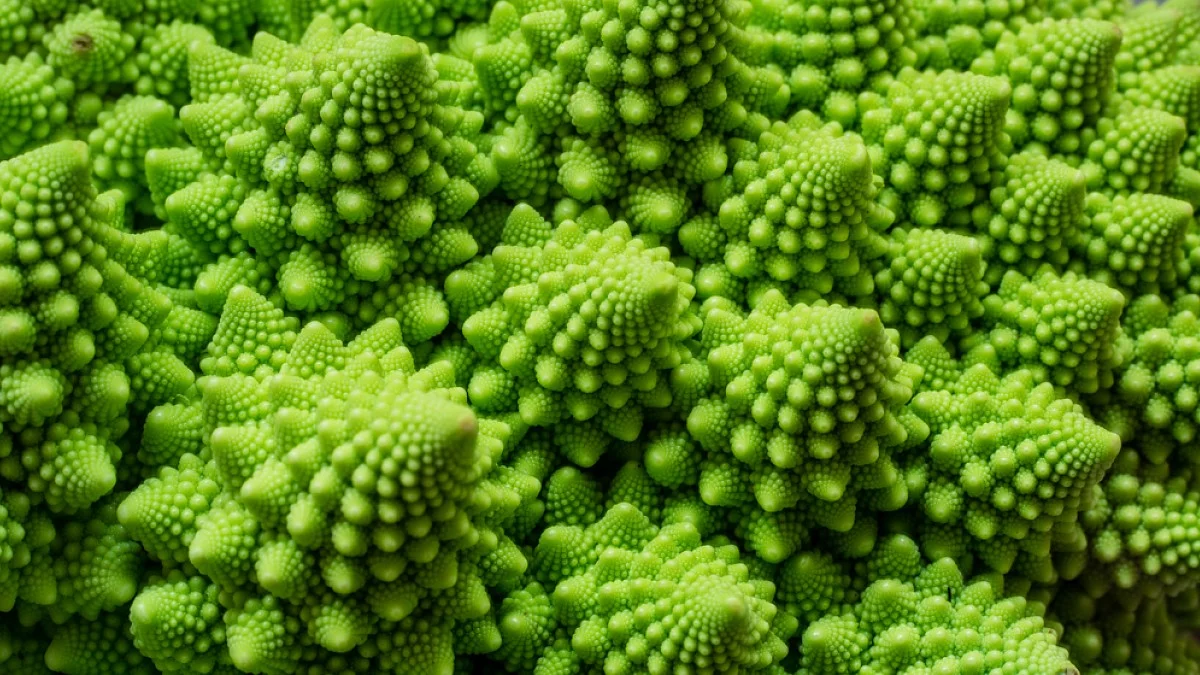
Fractals
What is a fractal? How the Mandelbrot set, Julia sets, Newton fractals (including Newton⁴) and Nova fractals are made, and why zooming never runs out of detail.
Ready to try it?
Open PictorX in your browser — no install, no credit card required to start.
Go to Editor