
The predator–prey cycle
The predator–prey system is one of the most important dynamic networks in ecology. It describes how the numbers of a predator and its prey keep influencing each other and holding each other in balance.
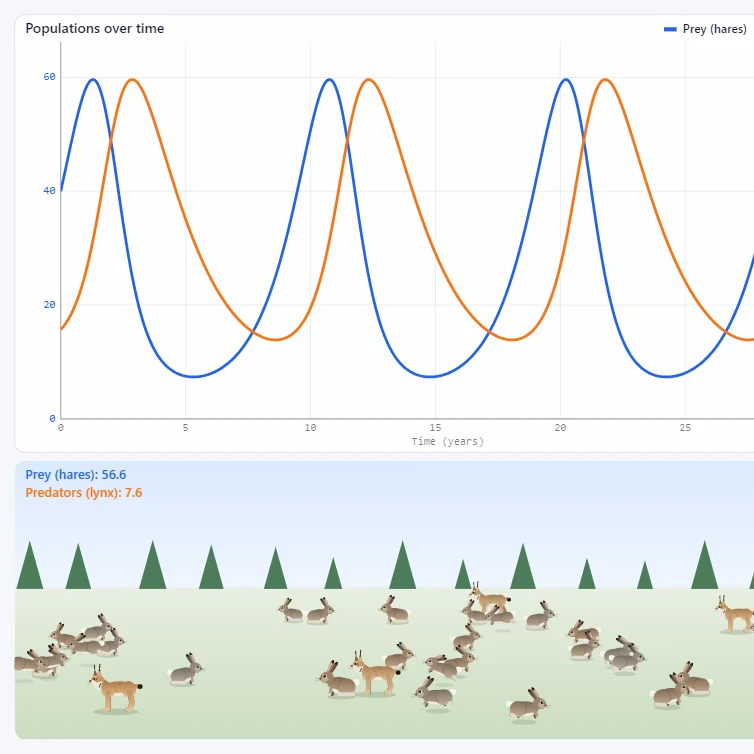
A network in balance
A predator and its prey are linked: the numbers of each depend on the other. Because this link is so predictable, both biologically and mathematically, it is often drawn as a cycle in which the two populations move in waves, one just behind the other.
The classic cycle
1. Plenty of prey: when there are many prey animals, there is food in abundance for the predators. 2. Predators grow: thanks to all that food, more predators survive and their numbers rise. 3. The prey collapses: the growing number of predators eats more prey than are born, and the prey population shrinks fast. 4. Predators decline: with prey scarce, the predators go hungry and their numbers fall again. 5. Recovery: with fewer predators about, the prey has the chance to recover and grow, and the cycle starts again.
Predators lag behind
Over a longer period the two populations move like two waves. The peak of the predators (orange in the app) always comes a little after the peak of the prey (blue). Predators need food before they can raise young, so their numbers keep climbing for a while after the prey has started to fall.
The Lotka-Volterra model
In systems biology this dynamic is calculated with the Lotka-Volterra equations, two coupled differential equations. For the prey N: dN/dt = rN - aNP. For the predator P: dP/dt = bNP - mP.
What each term means
rN: the prey grows exponentially at the rate r when there are no predators. aNP: the prey shrinks in proportion to how often prey and predators meet, which depends on both numbers. bNP: the predator grows from the food it eats, so it too depends on how often they meet. mP: the predator shrinks through natural death at the rate m. The two populations balance at N = m/b and P = r/a.
The lynx and the snowshoe hare
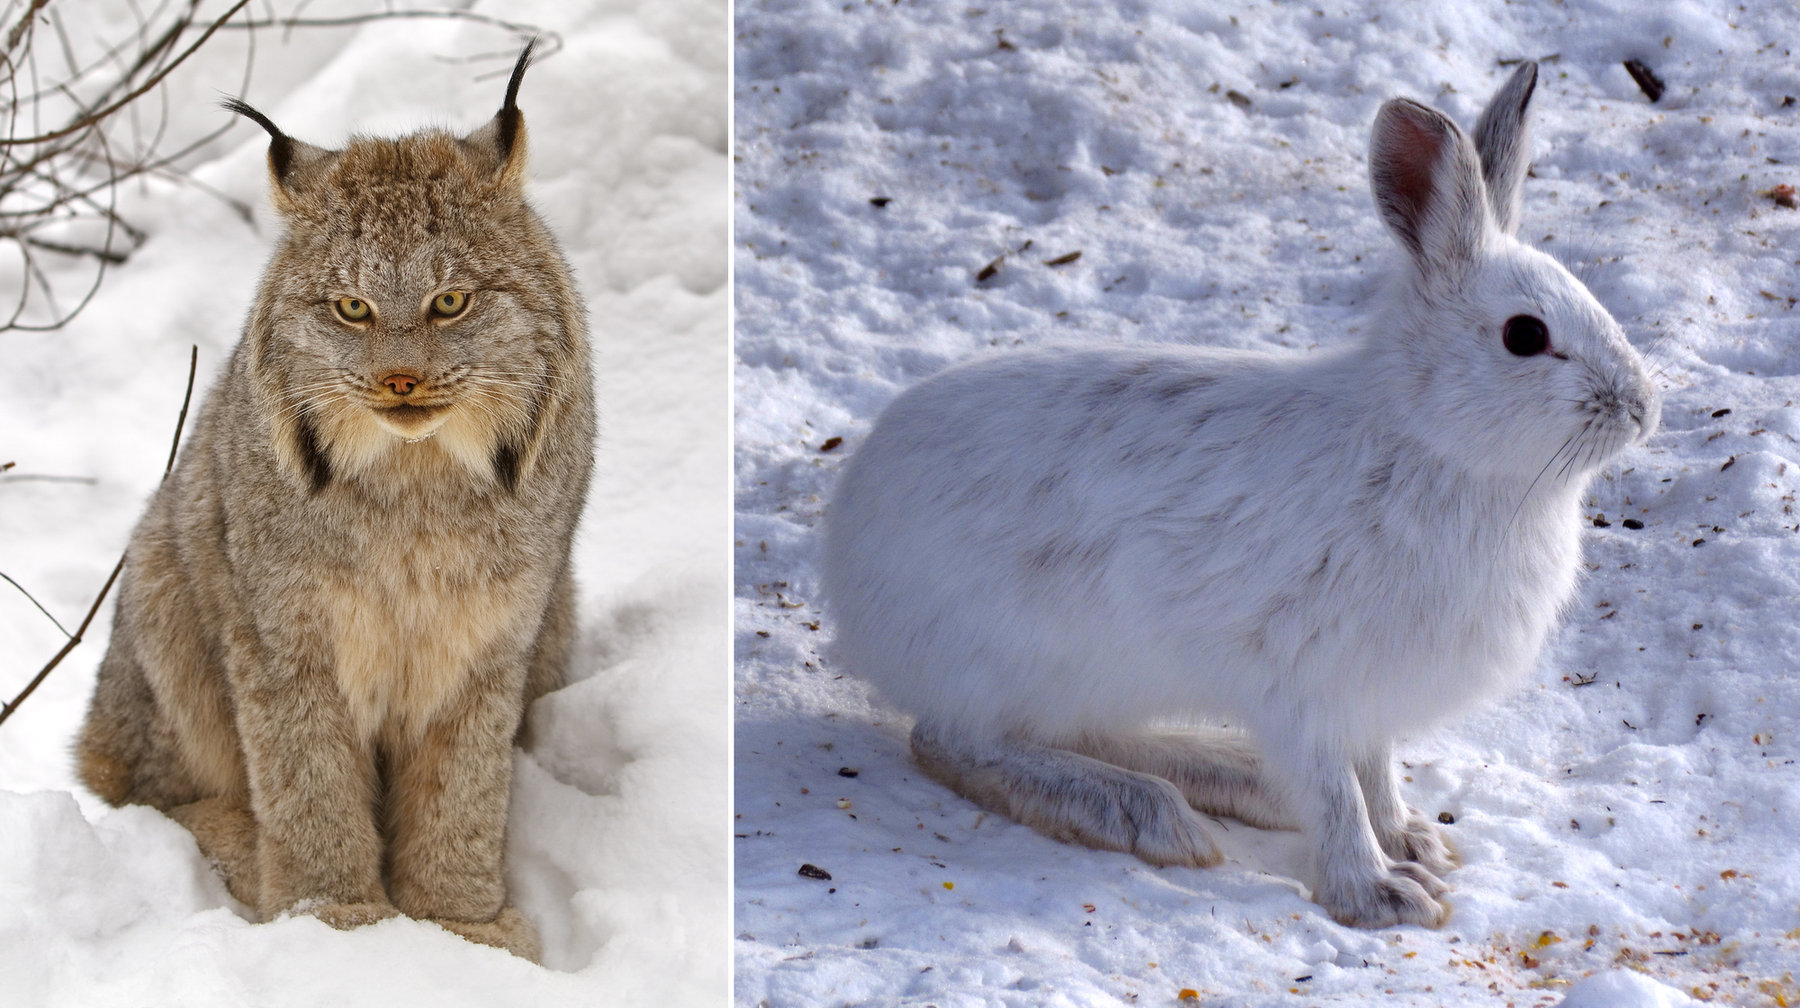
The best-known example from nature is the Canada lynx (the predator) and the snowshoe hare (its prey). From the historical fur-trade records of the Hudson's Bay Company, biologists found that the numbers of these two species have followed a steady, synchronised cycle of about ten years for more than a century.
Evolutionary arms races
Over many generations predator and prey also evolve against each other. Prey develop camouflage, speed, spines or venom; predators answer with sharper senses, stealth or resistance to poison. Each step forward on one side puts pressure on the other, which can change the rates in the model and the shape of the cycle.
Adding a third factor
Real food webs have more players. If the plants the hares eat are added, the prey can no longer grow without limit, and the cycles can calm down or become irregular. A changing climate can shift birth and death rates, and with three or more species the populations can even behave chaotically.
Frequently asked questions
Who discovered the Lotka-Volterra equations?
Alfred Lotka in the United States and Vito Volterra in Italy found the same equations independently in the 1920s. Volterra wanted to explain why the share of predatory fish in the Adriatic rose during the First World War, when fishing almost stopped.
How long does one cycle last?
Small cycles around the balance point last about 2π/√(rm). Larger cycles take longer. For the lynx and the snowshoe hare one cycle takes about ten years.
Is the Lotka-Volterra model realistic?
It is a simple model. It ignores limits on the prey's food, the time a predator needs to catch and eat, and chance. Even so, it explains the key pattern: waves in which the predator peaks follow the prey peaks.
Related tools
Predator–Prey
Watch hares and lynx rise and fall in the Lotka-Volterra model. Set the rates, see the predator peaks lag behind the prey peaks and follow the closed orbit in the phase plane.

Lorenz Attractor
Interactive Lorenz attractor: tune a, b, f, rotate in 3D, try neon/ink/smoke looks, and save a PNG.

The Lorenz Attractor
What is the Lorenz attractor? Edward Lorenz's convection equations, what each variable means, the butterfly effect, and why long-term weather forecasts fail.

Langton's Ant
Run Langton's Ant in your browser. Watch symmetry, chaos and the 104-step highway, then try multi-colour rules, several ants, a hex grid and turmites.
Galton board
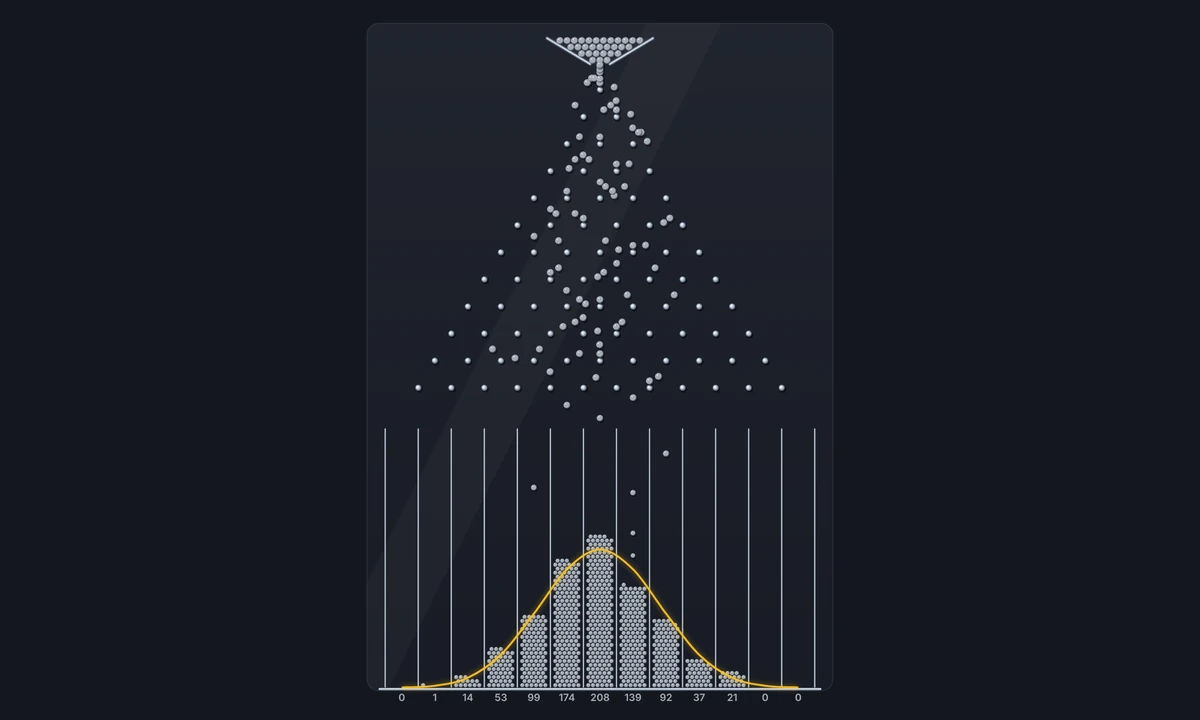
Drop balls through rows of pegs and watch a bell curve fill the bins. Change the rows, the bias, and the number of balls, and compare mean and spread with theory.
Monte Carlo π
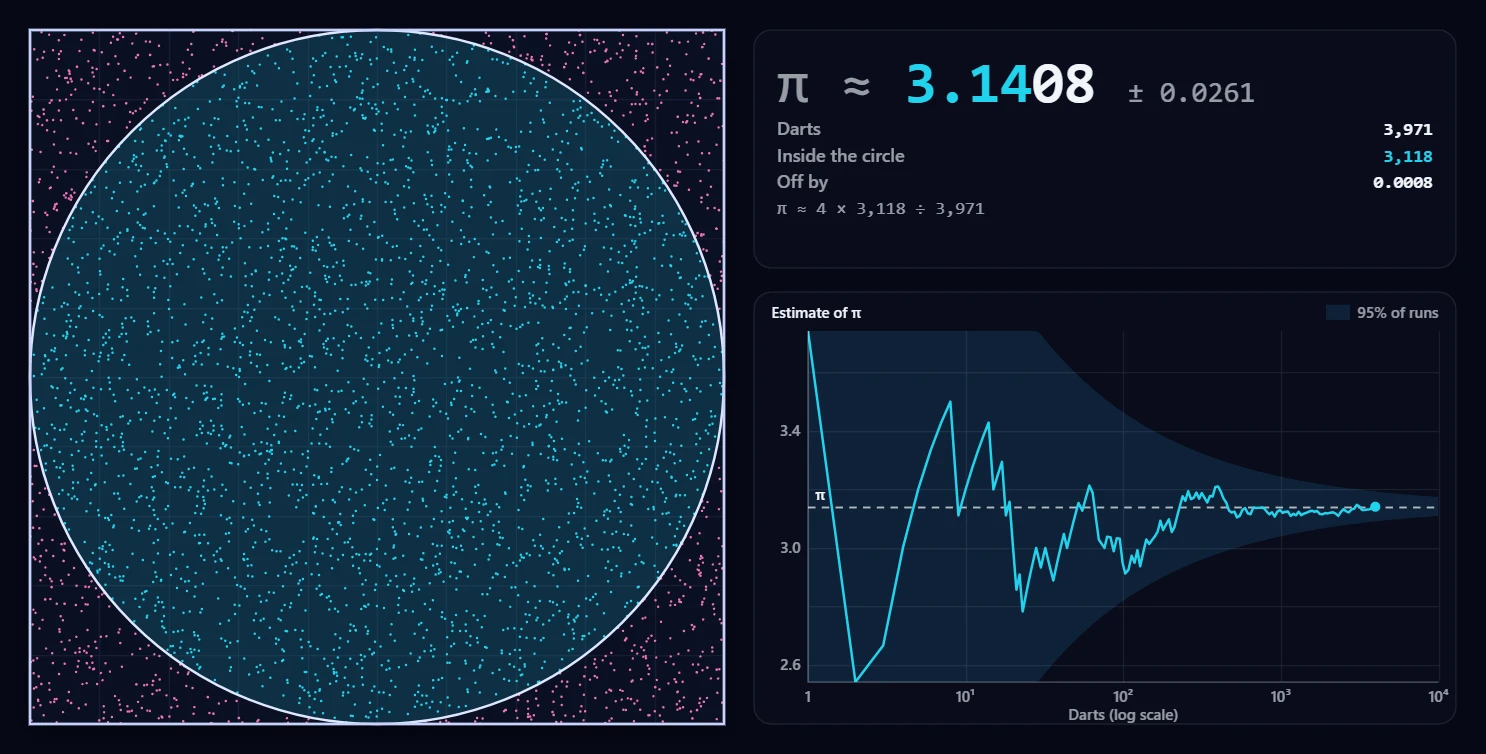
Throw thousands of random darts at a square with a circle in it and watch the share that lands inside turn into π. Start, stop, and follow the estimate as it converges.
Ready to try it?
Open PictorX in your browser — no install, no credit card required to start.
Try Predator–Prey