
Where each option's cases are
| Group | Successes | Total | Rate | Successes | Total | Rate |
|---|---|---|---|---|---|---|
| Overall | ||||||
Simpson's paradox
One treatment works better for small kidney stones and for large ones, yet worse for all patients together. That is Simpson's paradox. Enter success counts for two options in up to six groups, or start from one of three real examples, and see the rates per group and overall, whether they reverse, and why. Pick a real example or enter your own data: for two options, how many cases there were in each group and how many of them succeeded. The app compares the success rates in every group with the rates overall and shows when they point in opposite directions.
How it works
- Pick an example, or choose the number of groups and name your two options.
- Enter for each group how many cases each option had and how many of them succeeded.
- Compare the success rates per group with the rates overall, read the verdict and see where each option's cases are.
How a reversal happens
An overall rate is a weighted average of the group rates, weighted by how many cases each option has in each group. In the kidney stone study, open surgery succeeded in 93% of small stones and 73% of large ones, keyhole surgery in 87% and 69%. But 75% of the open operations were on large stones, which are harder to treat, against 23% of the keyhole ones. So open surgery comes out at 78% overall and keyhole surgery at 83%.
Which comparison to trust
The numbers alone cannot say. When the grouping causes both the choice of option and the outcome, like stone size here, compare within the groups: in this study, open surgery did better for both sizes. When the groups are themselves a result of the option, the overall comparison can be the right one. Look for a lurking variable whenever two groups are compared.
Frequently asked questions
Is Simpson's paradox a real paradox?
No: no rule of logic is broken. The surprise comes from expecting an overall rate to follow the group rates. Because the overall rate also depends on how the cases are spread over the groups, a reversal is perfectly possible, and the app shows that spread for both options.
What is the difference between a full and a partial reversal?
With a full reversal, the option that does better overall does worse in every group where the two differ: Simpson's paradox in its strict form. With a partial reversal, it does worse in some groups and better in others, as in the Berkeley admissions, where women did better in four of the six departments but worse overall.
Can I use my own data?
Yes. Choose two to six groups, name the two options and enter whole numbers: how many cases each option had in each group and how many of them succeeded. Your data stays in your browser, and Save as JSON keeps it in a file.
Related tools

How Simpson's paradox works
What is Simpson's paradox? Why a trend in every group can reverse when groups are combined, the arithmetic behind it, the Berkeley case and which to trust.

Two envelopes paradox
See why switching envelopes is not always better. Open one amount, compare the tempting 1.25 times average with the correct expectation, and run 10,000 pairs.

The birthday paradox
In a group of 23 people the chance that two share a birthday is 50.7%, and with 57 people it is 99%. See all 253 pairs, the calendar and the curve, and test thousands of random groups in your browser.

The Monty Hall problem
Pick one of three doors, watch Monty open one with a goat, then stay or switch. Play yourself or let the computer play 1,000 games and see switching win two times out of three.
Statistics calculator
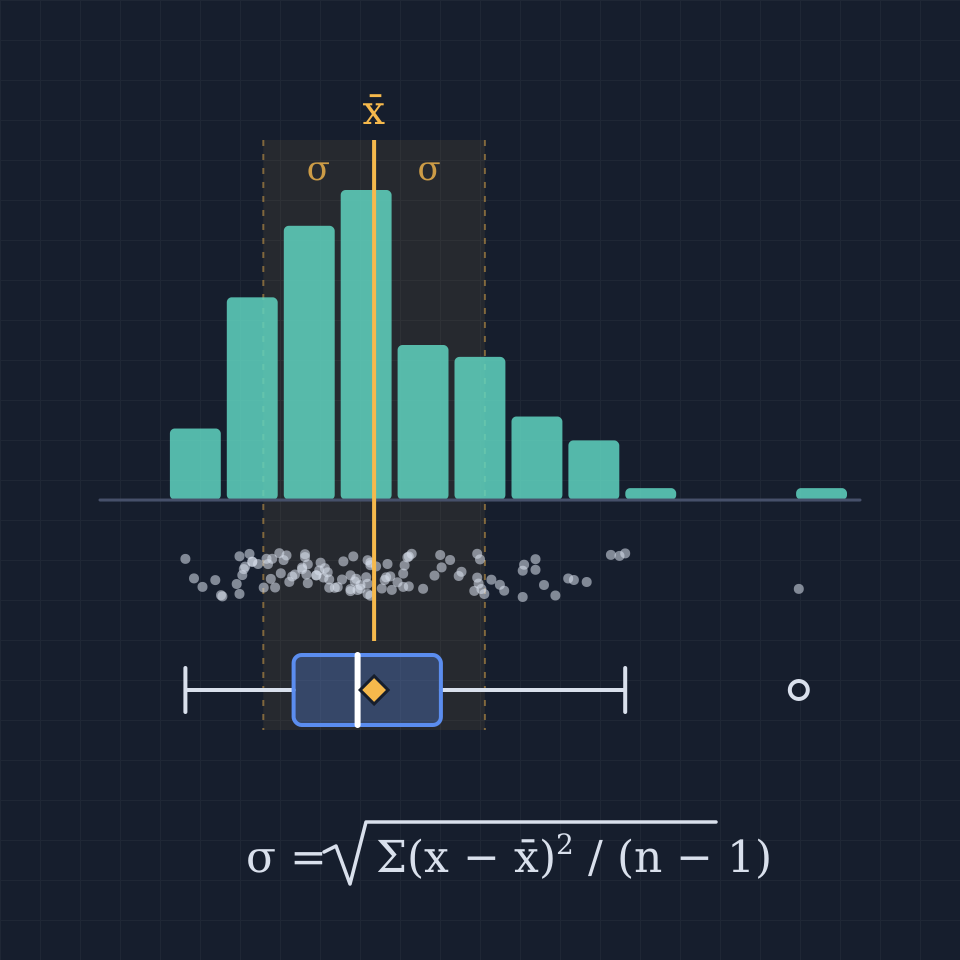
A free online statistics calculator: paste numbers and get the mean, median, mode, variance, standard deviation, quartiles and a histogram instantly.
Ready to try it?
Open PictorX in your browser — no install, no credit card required to start.
Go to Editor