
The four colour theorem explained
In 1852 a young mathematician colouring a map of the counties of England noticed that four colours seemed to be enough to keep neighbouring counties apart. Could that be true for every possible map? The question became one of the most famous problems in mathematics, attracted a celebrated false proof that stood for eleven years, and was finally settled in 1976 in a way that changed what mathematicians accept as proof.
The question
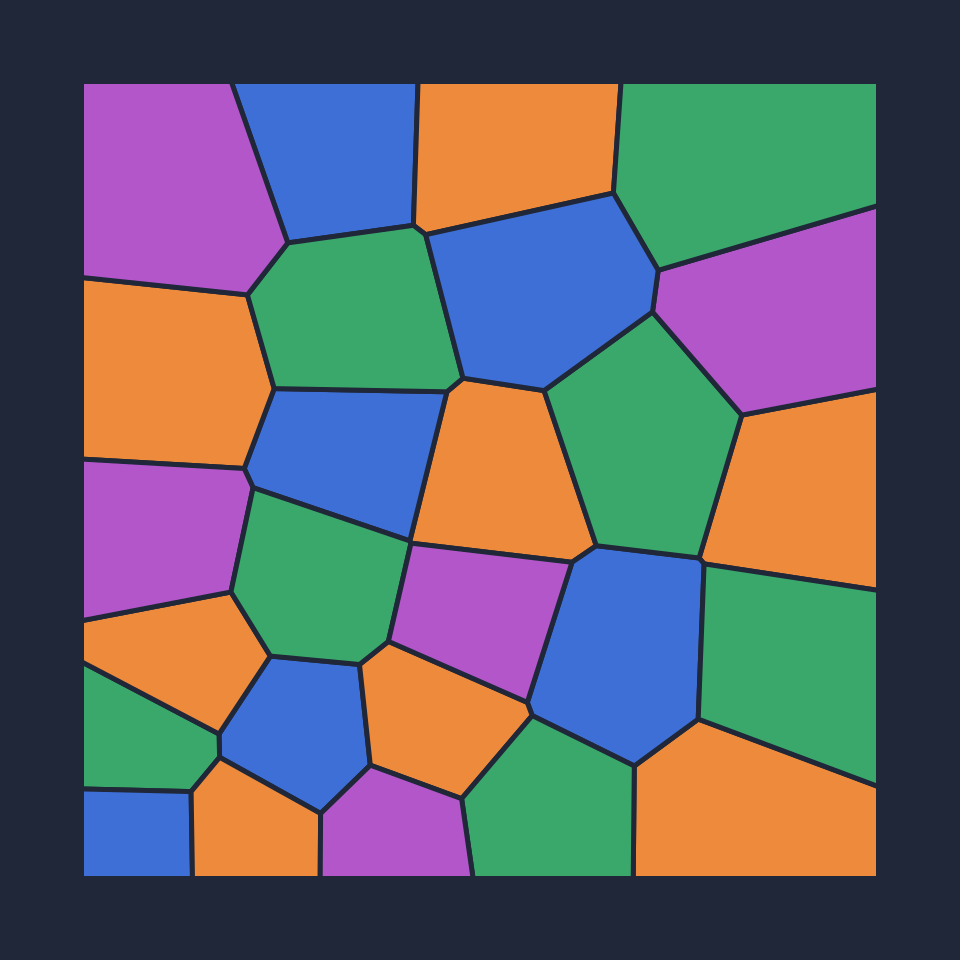
Francis Guthrie, a former student of Augustus De Morgan, asked whether any map can be coloured with four colours so that countries sharing a border get different colours. Two rules make the question precise. Countries must be connected, each one piece, and countries that meet only at a single point do not count as neighbours. Three colours are clearly not always enough, since a country surrounded by a ring of three others that all touch needs a fourth. The question is whether a fifth is ever needed.
Maps as graphs
Mark a point in each country and draw a line between two points whenever their countries share a border. The result is a graph, and because the map lies on a flat sheet, the lines can be drawn without crossing: the graph is planar. Colouring the map is colouring the vertices of this graph so that the ends of every edge differ. The smallest number of colours that works is the chromatic number, and the four colour theorem states that no planar graph has a chromatic number above four.
Kempe's proof that failed
In 1879 the barrister and mathematician Alfred Kempe published a proof. Its clever idea, now called Kempe chains, is to swap two colours along a connected chain of countries to free up a colour where it is needed. The proof was accepted for eleven years, until Percy Heawood found a gap in 1890. Heawood's repair proved a weaker result: five colours are always enough. Kempe's chains survived and became a tool in the eventual proof.
Why five is easy
Every planar graph has a vertex with at most five neighbours; this follows from Euler's formula, which limits a planar graph with n vertices to at most 3n − 6 edges. Remove such a vertex, colour the rest of the map by the same argument, and put the vertex back. If its neighbours use fewer than five colours, one is free. If they use all five, a Kempe chain swap always frees one. With four colours the same swap can fail, which is exactly the gap Kempe missed.
The computer proof
In 1976 Kenneth Appel and Wolfgang Haken at the University of Illinois proved the theorem. They showed that every map contains at least one of 1,936 configurations from an unavoidable set, and that each configuration is reducible: a smallest map that needed five colours could not contain it. Checking reducibility took more than a thousand hours on computers, far too much to verify by hand. Many mathematicians were uneasy with a proof no person could read in full, and the debate about computer-assisted proofs began.

Simpler proofs and full verification
In 1996 Neil Robertson, Daniel Sanders, Paul Seymour and Robin Thomas published a more systematic proof with 633 configurations, still checked by computer but easier to verify. In 2005 Georges Gonthier and Benjamin Werner formalised the entire proof in the Coq proof assistant, so that a small, trusted program checks every logical step. Today the four colour theorem is one of the most thoroughly verified results in mathematics.
Colouring algorithms
Finding a four-colouring of a given map is fast in practice, but finding the fewest colours for a general graph is hard: deciding whether three colours suffice is NP-complete. Practical methods include greedy colouring in order of decreasing degree, DSATUR, which colours the most constrained vertex next, and backtracking search, which explores choices and undoes them when stuck. Graph colouring schedules exams without clashes, assigns radio frequencies so neighbouring transmitters do not interfere, and allocates registers in compilers.
Explore it
Open the four colour map painter to generate maps of 4 to 120 countries, paint them by hand with four colours, and watch clashes appear in red. Let greedy colouring, DSATUR or backtracking solve the map step by step, show the graph of neighbouring countries, and check the fewest colours the map really needs.
Frequently asked questions
Does the theorem help mapmakers?
Hardly. Real maps are usually coloured with more colours for clarity, and they include oceans, lakes and countries in several pieces, which the theorem does not cover. Its importance is mathematical: it drove the development of graph theory and raised the question of what counts as a proof.
What is a Kempe chain?
Take two colours, say red and blue, and a country coloured red. Its Kempe chain is the set of all red and blue countries you can reach from it by stepping only through red and blue neighbours. Swapping red and blue throughout the chain keeps the colouring valid, and can free a colour for a country next to the chain.
Why do countries in several pieces break the theorem?
If a country may consist of separate regions that must all have the same colour, the neighbour graph is no longer planar, and maps can be built that need any number of colours up to 12 for two pieces per country, as Heawood studied in his empire problem.
Why does the painter make maps from points?
Each country is the region of the square closer to one random point than to any other, a Voronoi diagram. This gives realistic-looking maps of convex countries, and two countries are neighbours exactly when their regions share a stretch of border, which the app computes precisely.
Related tools
Four colour theorem map painter
Colour a random map so that no neighbouring countries share a colour. Paint by hand or watch greedy, DSATUR and backtracking solve it, and check the fewest colours the map needs.
Graph Theory Playground
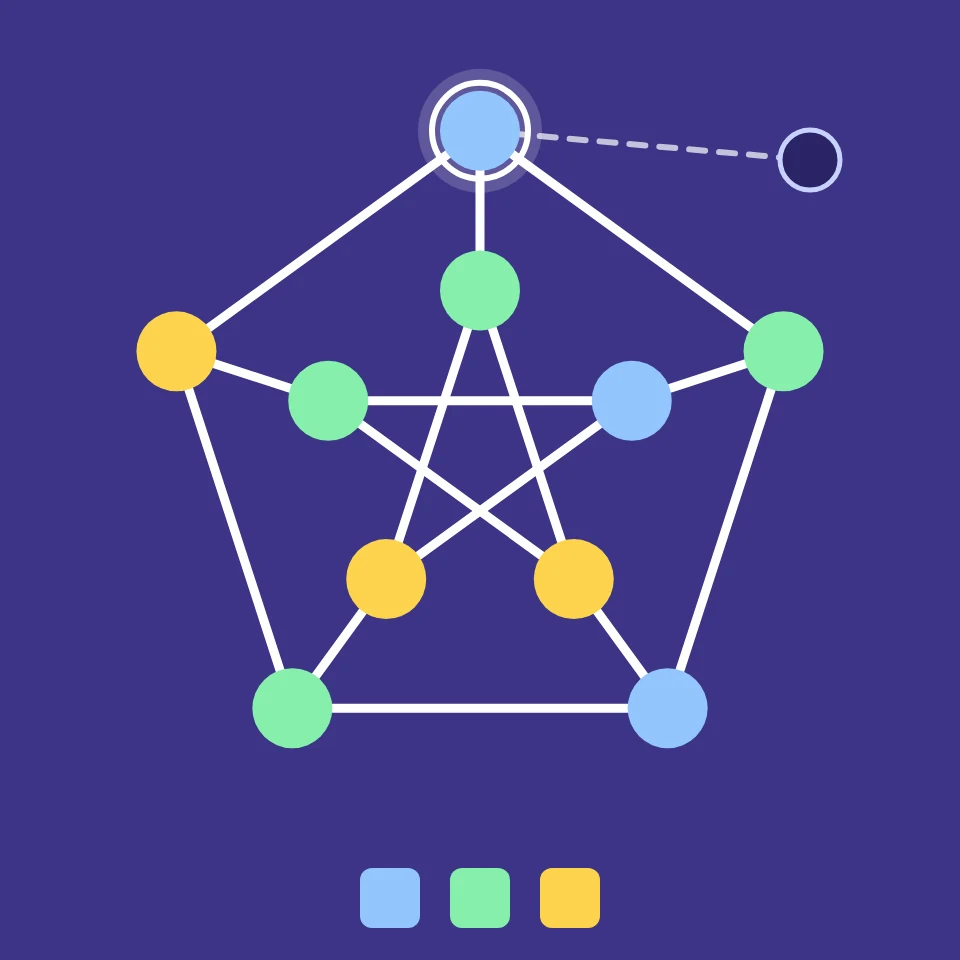
Draw a graph with a few clicks and see its properties at once: degrees, connected, bipartite, chromatic number, shortest cycle, Euler path or circuit, spanning tree and diameter.
Traveling salesman problem
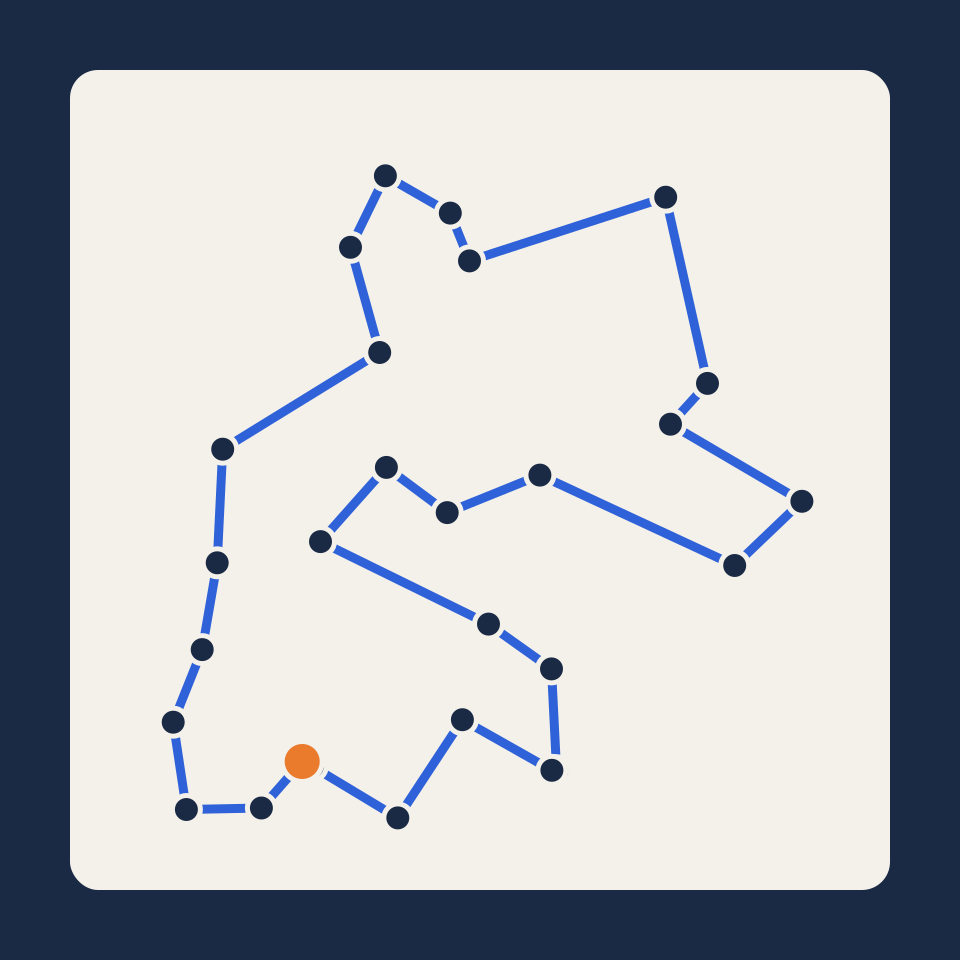
Place up to 200 cities and watch five methods search for the shortest round trip: nearest neighbour, cheapest insertion, 2-opt, simulated annealing and the exact Held–Karp algorithm.
Minimum spanning tree
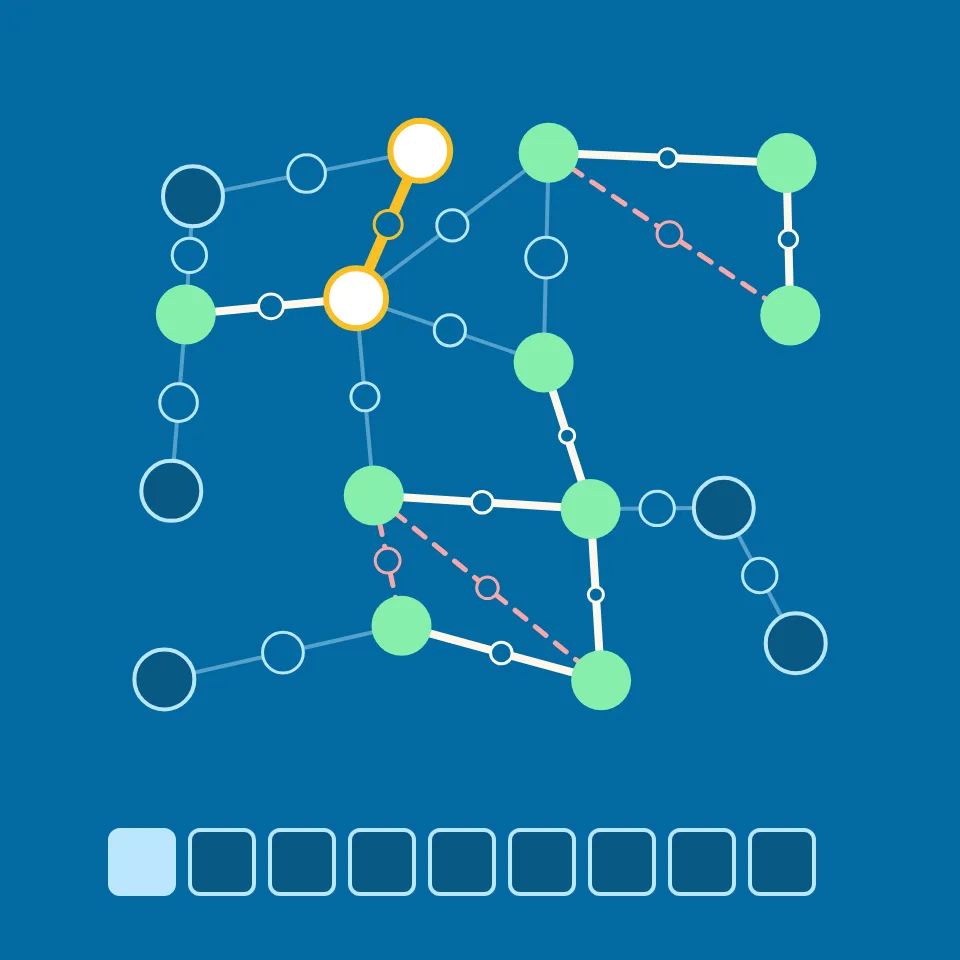
Watch Kruskal's and Prim's algorithms build a minimum spanning tree step by step: connect every node of a weighted graph at the lowest total length.
Zeno's paradoxes
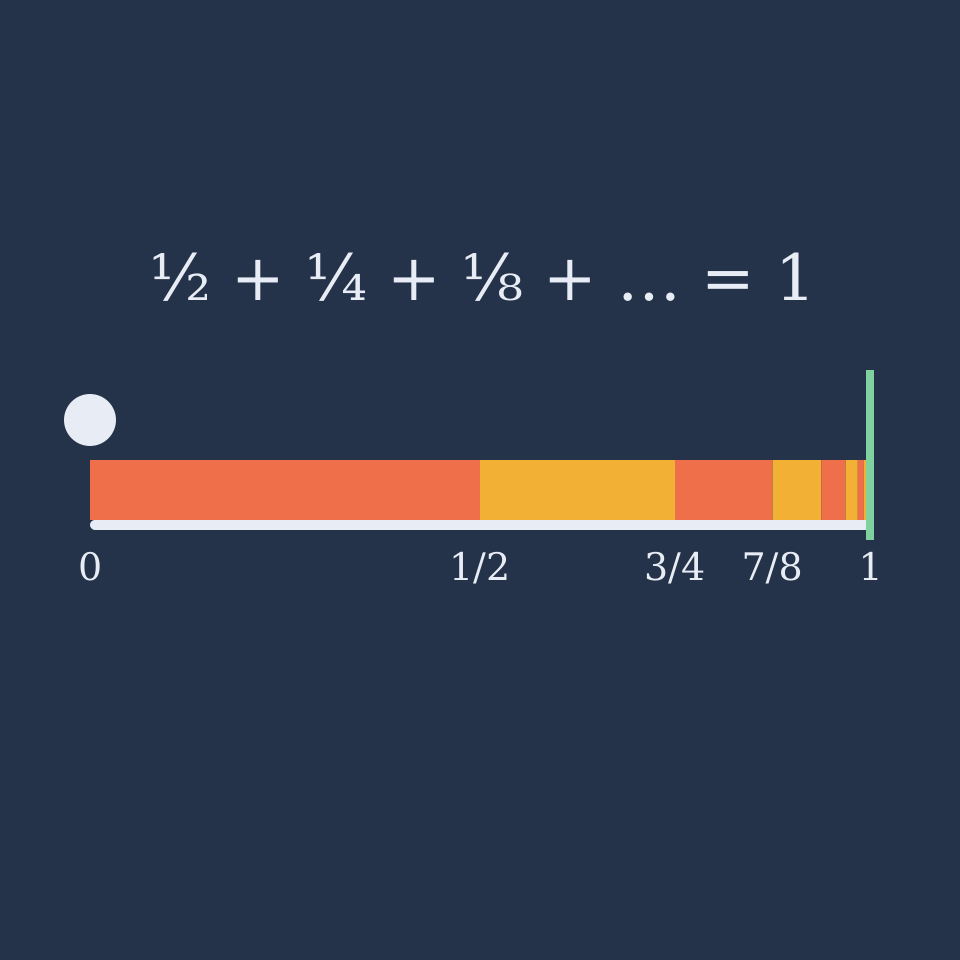
Step through Zeno's dichotomy, race Achilles against the tortoise and freeze the flying arrow. See infinitely many steps add up to a finite total, and speed emerge as a limit.
Ready to try it?
Open PictorX in your browser — no install, no credit card required to start.
Open the four colour map painter